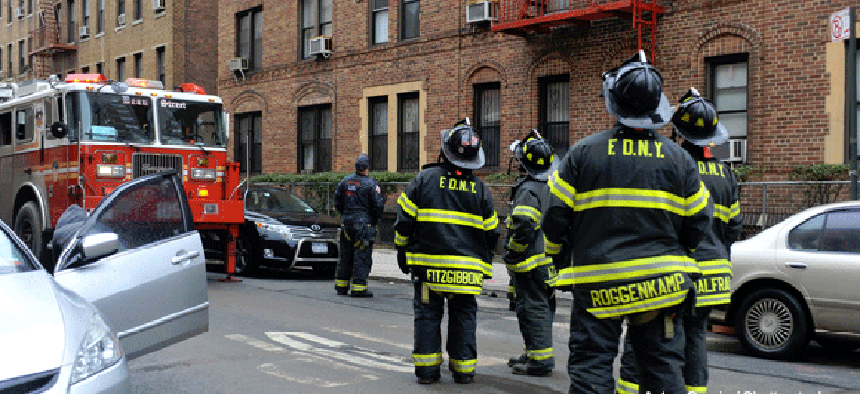
How FDNY uses analytics to find potential fire traps


Connecting state and local government leaders
The Risk Based Inspection System mines data from city agencies to help firefighters prioritize inspections.
The prudent use of data and analytics is changing the way the New York City Fire Department conducts daily building inspections, helping the city’s 341 fire units more accurately target for inspection buildings that are potential fire risks.
FDNY has implemented the Risk Based Inspection System, which mines information from databases across the city to help prioritize the 50,000 buildings firefighters inspect annually.
Each fire unit is responsible for inspecting buildings within its immediate response area -- examining several buildings a week for safety conditions -- but until recently had limited information about each structure. Fire officials wanted to be able to rank buildings in terms of their fire risk, said Lauren Talbot, chief programmer for the Mayor’s Office of Data Analytics (MODA), which assisted FDNY in collecting and analyzing data. FDNY officials have 300,000 buildings in their inspection universe, but can only check 50,000 annually, which is why prioritizing inspections is so important, Talbot said.
FDNY built a data warehouse, where the department could store inspection information, such as the building’s occupancy class, whether or not it has sprinklers or if it is fire-proof. The Risk Based Inspection System pulls information from the FDNY data warehouse as well as from databases from the City Planning, Buildings, Environmental Protection and Finance departments, using MODA’s DataBridge, a common data infrastructure containing regulatory information ranging from health inspections to illegal dumping.
The system uses a risk-based model to track, score, prioritize and then automatically schedule a building for inspection. It lets FDNY prioritize inspections based on specified risk criteria, such as the type of building (home, storefront, manufacturing facility), the construction material, the building’s fire-proof features, the height and age of the building, the last inspection date, occupancy and violation history.
Using a suite of SAS statistical analysis and predictive modeling tools, the MODA team was able to collect “information and reorganize the data in a way that is analytically advantageous” for the FDNY’s newly created analytics team, Talbot said.
MODA used SAS analytic tools to validate and improve the system as well as to analyze and prioritize risk. The team fed the agencies’ data into the FDNY data warehouse to come up with the analysis and then embedded that analysis into the FDNY risk system.
TheFDNY analytic team also is looking to improve upon that analysis using SAS tools, Talbot said, planning to expand the model with additional data sources including fire history and fire code enforcement actions. Additional data and risk factors will be included over time.
The Risk Based Inspection System was launched in May so it is too early say if it has reduced fires, but “we are seeing that the system is stable in its ability to predict,” Talbot said.
The work with the FDNY is part of MODA’s larger task of providing risk-assessment and predictive resource allocation for more than 40 city agencies. The organization is using predictive data analytics to discover and act upon patterns in city data. MODA has taken all the regulator agency data and created a common data infrastructure for agencies to access and extract data from a DataBridge. The DataBridge unites siloed information into a single source, allowing for cross-departmental investigation, Talbot noted.

NEXT STORY: One way to get real-time info to crews fighting wildfires


