NWS poised for flood season with sharper tools for mapping risk


Connecting state and local government leaders
The National Weather Service has a number of tools to help gauge the risk of seasonal flooding, including maps that show both landscape elevations and water depth.
Record snowfalls this winter mean government weather forecasters will be looking for signs of heavier melt – and potential flooding – as spring nears.
The National Weather Service has a number of tools to help gauge the risk of seasonal flooding, including topographical maps that show which areas in a region are prone to be under water when a river overflows its banks.
But while these older maps help chart areas at risk, they leave out an important piece of information: How deep will the water be in a given location?
"The reason the water depth is so important is that allows people to really understand what their flood risk is," said Laurie Hogan, program manager of the National Weather Service's Hydrologic Services Division.
If people know their property will be under eight feet of water, different measures are called for than if they're expecting one foot of water. "Depending on the lead time they have, they can move things to the second floor," she said. "If they see that they'll have roadways that will be blocked they can decide to go stay with someone else."
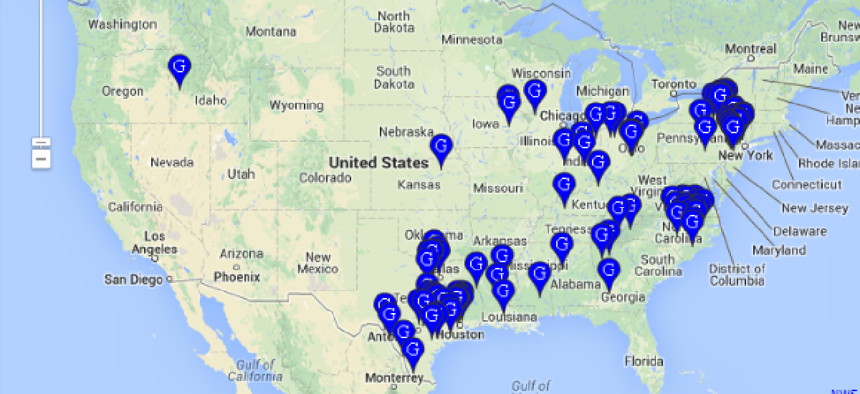
To address the need for that kind of information, the National Weather Service in September 2007 began producing inundation maps that emergency planners and residents alike can use to view the extent and depth of flooding in selected areas. To date, 28 locations have been mapped.
The key technologies that have enabled inundation mapping are high-resolution LiDAR data and improved hydrologic modeling. LiDAR (light detection and ranging) devices measure elevation of the landscape – a key factor in flood prediction – by emitting laser pulses and measuring the time required for the pulse to reflect back to the device.
"The underlying data keeps getting better and better," Hogan said. "We get the water depth information by using the water surface estimation from the hydraulic model and subtracting the elevation data."
In addition to displaying terrain, the maps also indicate where streets, buildings, airports and other infrastructure are likely to be impacted by floodwaters. "It does pan and zoom," Hogan said. "It does geolocation. You click on the map and the nearest address pops up along with information about what you clicked on."
"We are on our second version of our interactive flood map viewer," Hogan said. "In 2012 we updated it to use Google Maps. Prior to that, we didn't really have zoom-in features." What's more, according to Hogan, moving from a custom viewer to Google Maps cut the cost of creating maps in half.
"There's really a lot of information that people can take away from these maps," Hogan said. "And emergency managers in river communities can use these maps to help determine which neighborhoods need to be evacuated and which streets need to be closed."
NEXT STORY: What data architects can learn from food labels


