Geospatial tool tests for energy cost sweet spots


Connecting state and local government leaders
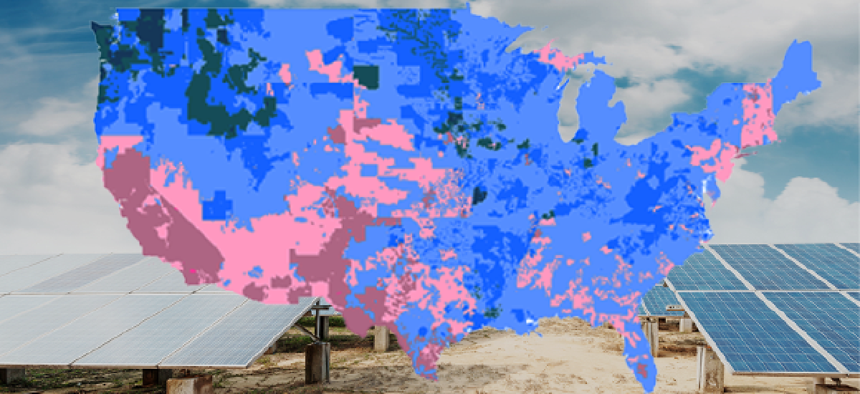
The FEMP Screening Map, developed by Energy Department researchers, combines big data and geospatial technology to determine whether renewable energy projects are cost-effective.
Department of Energy researchers have combined big data and geospatial information system technology to create an interactive application that federal facility managers can use to determine when renewable energy projects will be cost-effective.
The FEMP Screening Map, developed by the Federal Energy Management Program and the geospatial staff at the National Renewable Energy Laboratory, was released in beta on Oct. 2. The map allows users to examine the viability of three solar technologies (photovoltaics, solar ventilation preheating and solar water heating) by comparing the amount of available sunlight in a given location, the efficiency of the solar technologies, the cost of other available energy sources and the impact of any incentives for employing renewable energy sources.
According to Andy Walker, principal engineer at NREL, the map is based on NREL’s geospatial map capabilities together with data collected by the National Oceanic and Atmospheric Adminstration’s Geostationary Operational Environmental Satellite (GOES) imagery program. “I was impressed by the resource maps that NREL had published,” he said.
The creation of the application also depended on a certain amount of professional serendipity. The project took off when Walker discovered that another researcher – Richard Perez at the State University of New York – had developed an algorithm to calculate how much sunlight a given location receives based on the amount of light reflected back to the satellite.
That’s when Walker realized its potential as an analytics tool. In addition to NREL and NOAA data, Walker and his colleagues collected data sets from a variety of other sources, including a map of utility rates in the United States and fuel escalation rates supplied by the Office of Applied Economics at the National Institute of Standards and Technology.
The fusion of data lets users locate likely areas for investing in solar conversions by using the map’s tools to calculate the savings over the life of the system – based on not just the initial cost, but also operating and maintenance charges.
“I think of it as math between maps,” said Walker.
Walker said the map will be useful for federal agencies, which have been required to obtain 20 percent of their energy usage from renewable sources by 2020. Currently, the figure is only about 7.5 percent.
Walker envisions that energy managers “are going to be looking at the map saying, ‘Okay, we’re going to focus our efforts to identify photovoltaic projects in this part of the country … and we want our facilities to consider solar water heating if they’re in this part of the country.’”
The team is now looking to expand the map to include other renewable energy sources, such as wind energy. “We have completed a wind-energy analysis, which we will be putting up in the next couple of weeks,” Walker said.
NEXT STORY: SSA to expand enterprise e-discovery toolset


