Disaster dashboard taps local open data


Connecting state and local government leaders
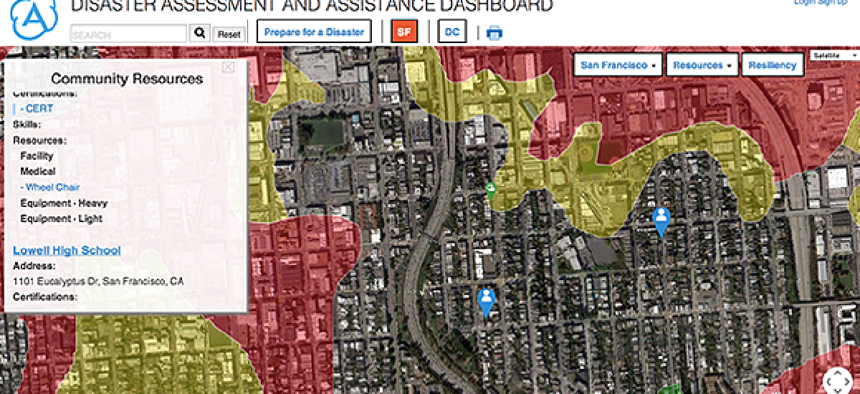
The Disaster Assessment and Assistance Dashboard enables citizens, businesses and governments to share resources, request assistance and better understand the potential and timeline for recovery.
The next time an earthquake strikes San Francisco, residents may be able to access a dashboard to see where to get treatment for injuries, find temporary housing and even locate a backhoe to clear a street or driveway.
Coincidentally, I interviewed Yo Yoshida, CEO of Appallicious, which has its U.S. headquarters in San Francisco, only four days before a 6.0 temblor struck the Bay Area, causing an estimated $1 billion in damage and injuring more than 120.
Yoshida had just returned from demonstrating his company’s new Disaster Assessment and Assistance Dashboard (DAAD) at the White House’s Innovation for Disaster Response and Recovery Demo Day.
DAAD, which is still in beta, combines data streams from government agencies as well as data offered by local residents and neighborhood associations. When disaster strikes, residents and responders alike can access road conditions, weather information, relief locations and whatever other data the subscribing jurisdiction has configured the browser-based application to display.
When it is ready for market, which is expected this fall, DAAD will allow participating cities and towns to select from hundreds of data sets that will provide information on evacuation routes, environmental hazards and the location of critical infrastructure.
The data will vary by locality. “One of the biggest problems here is earthquakes,” said Yoshida, sitting in his San Francisco office, “so liquefaction zones are a huge issue.” That data may not be important for another locality, but temperature zones might be important for an area that is prone to heat emergencies.
In addition to fusing a wide array of environmental and infrastructure data, what makes DAAD special is the inclusion of local data.
“You can populate what assets you have,” Yoshida said. “High schools may have first aid or sleeping facilities. Construction companies may have backhoes. Who has defibrillators? Who has chainsaws? The idea is to identify local resources and to map them.”
As with most projects that include crowdsourced data – or even neighborhood-association-sourced data – ensuring the reliability of that data will be critical to users having trust in the application as a whole.
Yoshida says that his team hasn’t yet figured out how they plan to verify data from third-parties. “We’re in the learning process right now,” he said. “For the most part, the initial gateway will be with neighborhood associations.”
DAAD can also be used in advance of a disaster to take proactive action. In addition to providing a utility that allows residents to assemble and print disaster plans, including evacuation routes and resource locations, the program is designed to be used by planners to spot vulnerabilities.
“We can see what assets are not the right place,” Yoshida said. “Does it make sense if we know a flood is coming to move assets into another area?”
Recognizing that the primary use of the dashboard would be in the wake of a disaster has presented special challenges. First, the team decided to bring all data from outside sources into its own databases. “Having real-time streaming of data from the agencies is, during disasters, not sustainable,” Yoshida said.
Yoshida is also aware that many people may not have Internet access in the wake of a disaster. “In the bigger picture, we’d like to have some sort of neighborhood hub with satellite links to ensure connectivity,” he said.
Yoshida also says he’d like to integrate social media, such as Twitter feeds, so that people can learn in real time about conditions in localities.


