The Economic Cost of Devastating Hurricanes and Other Extreme Weather Events is Even Worse Than We Thought

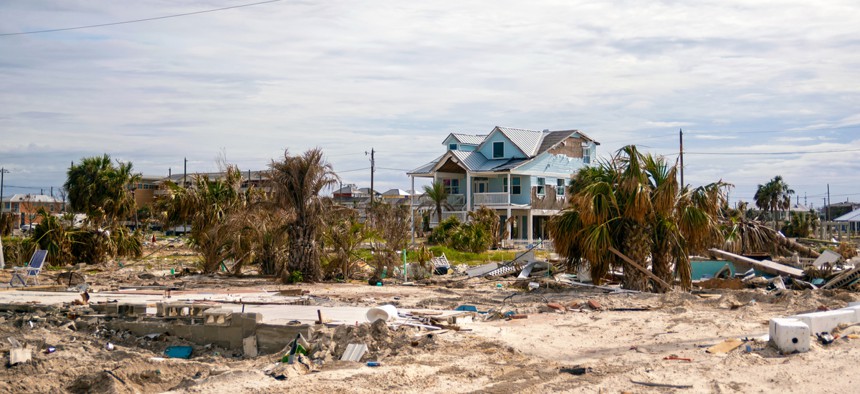
Many Florida towns were devastated by Hurricane Michael in 2019. Alex LeStourgeon/Shutterstock

Connecting state and local government leaders
With hurricane season starting in June, coastal areas should understand the comprehensive cost of storm damage.
June marks the official start of hurricane season. If recent history is any guide, it will prove to be another destructive year thanks to the worsening impact of climate change.
But beyond more intense hurricanes and explosive wildfires, the warming climate has been blamed for causing a sharp uptick in all types of extreme weather events across the country, such as severe flooding across the U.S. this spring and extensive drought in the Southwest in recent years.
Late last year, the media blared that these and other consequences of climate change could cut U.S. GDP by 10% by the end of the century – “more than double the losses of the Great Depression,” as The New York Times intoned. That figure was drawn from a single figure in the U.S. government’s Fourth National Climate Assessment. (Disclosure: I reviewed that report and was the vice chair on the third one, released in 2014.)
If that sounds scary, I have good news and bad news. The good news is that that figure was drawn incorrectly from a significant misreading of the report - which actually offered a range of a loss of GDP from as low as 6% to as high as 14% by 2090.
The bad news, however, is that a more meaningful assessment of the costs of climate change – using basic economic principles I teach to undergrads – is a hell of a lot scarier.
Tallying the Costs
First, let’s look at how government agencies, insurance companies and the media calculate and report on the economic costs of disasters.
According to the National Oceanic and Atmospheric Administration, in 2018 hurricanes Michael and Florence each caused about US$25 billion in damages, contributing to a total toll of $91 billion from that year’s weather and climate disasters. In 2017, the NOAA’s total was even bigger: $306 billion, due to the massive destruction from hurricanes Harvey, Irma and Maria.
But these tallies are not really valid measures of economic damage. Instead, they simply reflect estimates of what people think will need to be invested to rebuild what was damaged or destroyed in the storms, floods or fires.
To really understand the economic costs of an extreme weather event, it’s important to consider all the investment that is being “crowded out” or lost to cover those rebuilding costs. Put another way, there’s only so much money to go around. And that $25 billion being used to rebuild means $25 billion is not being used for other public and private investment opportunities that are more forward-looking or more likely to promote growth.
Accounting for Growth
Instead, I believe a fundamentally more sound way to do this is to use something called “growth accounting.”
Growth accounting incorporates the productive use of capital and innovation into the equation. The question we want to ask is what happens to GDP growth when recovery efforts from extreme events crowd out productive investments, like building new factories or roads and bridges?
Returning to NOAA’s estimated losses for 2017 and 2018, productive investment fell about $400 billion in total in those years as a result. That is, had those disasters not happened, investment would have been that much higher. And that diminished investment translates into less growth in gross domestic product – a measure of all an economy produces in a given period.
If similar experiences in extreme events occur for the next 10 years – which is not a bad assumption given that four of the most expensive years in history have occurred in the last five – U.S. GDP in 2029 would be about 3.6% lower than it would have been otherwise, based on my calculations using growth accounting.
That amounts to an economy that’s $1 trillion poorer as result of these extreme weather events crowding out productive investment.
This is the real cost of a world in which these types of massively destructive disasters happen more frequently.
Sooner and Scarier
Returning to our 10% figure, 3.6% is comparatively smaller, of course, but it’s much sooner, which makes it much scarier.
Why?
Because the number of extreme events and their destructive power keeps increasing at an accelerating rate. If we can expect to take a $1 trillion hit over just the next decade, the costs by the end of the century are hardly fathomable.
So while I may disagree with the numbers The New York Times and others use in tallying disasters, they are right to try to spur readers to action.
The situation is just a lot more dire then anyone realizes. With any luck, the size of the figure will frighten us to do more to stave off the worst.
This article is republished from The Conversation under a Creative Commons license. Read the original article.
Gary W. Yohe is the Huffington Foundation professor of economics and environmental studies at Wesleyan University.

NEXT STORY: Trade Groups, Lawmakers Deride Trump’s Mexico Tariff Plan


