The state of broadband resources, all in one place

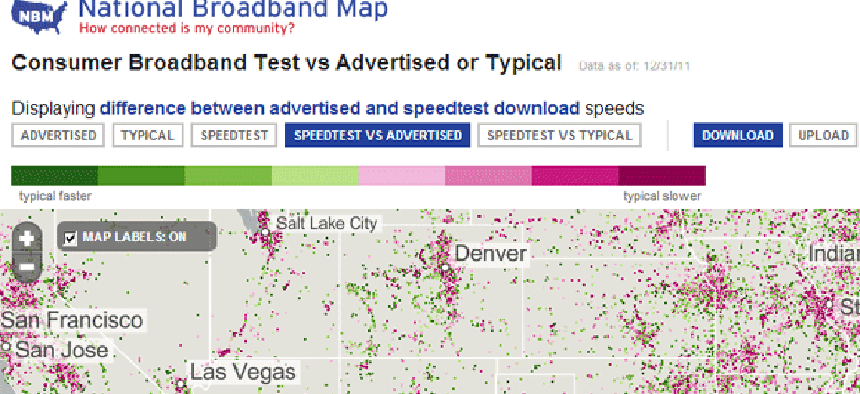
The National Broadband Map, the biggest dataset of its kind, supports the drive to extend high-speed Internet service to everyone.
In January 2009 President Obama established an agenda for universal broadband: a plan to make high-speed Internet service available to all Americans. To support the effort, analysts needed a tool to help identify areas of the country that were underserved — or left out altogether.
Congress asked the Federal Communications Commission and the National Telecommunications and Information Administration (NTIA) to develop a broadband map that would let policy analysts and other stakeholders make informed, data-driven, broadband funding decisions. It would be designed to also help inform consumers about broadband in their locations.
Working with Computech Inc., a software development firm in Bethesda, Md., the FCC and NTIA designed a public-facing, searchable and interactive broadband map. The entire project was built with open protocols on open source software and fully transparent data, said Mike Byrne, geographic information officer at the FCC.
“We wanted to make sure that anyone interested in broadband or big data — whether a large corporation, an individual researcher or a kid in a garage — would have the same access and opportunity to build off of what we did,” he said. “And they can, without any barriers, license agreements or restrictions whether for data or software.”
(From left: Don Harris, Xiaoming Qin, Dorota Wilke, Ivan Djordjevic, Paul Salasznyk, Eric Spry, Santosh Moghulla, Juan Marin, Nathaniel Guieb, Michael Byrne)
Containing data on broadband providers, technologies and speed availability based on tens of millions of records collected from 1,700 providers across the country, the map went live in February 2011. Since the launch, there have been more than 3 million page views and 600,000 unique visitors. Anne Neville, director of the state broadband initiative for NTIA, said that biggest challenge was the project’s timeline. “We built the entire project from scratch,” she said. “We had to integrate the data collected by 56 partners across the country and then develop a visual interface--the map--to meet the needs of many different users.
After developing program guidelines and awarding grants and contracts, we effectively had a little over a year to collect over 25 million records and publish them in a searchable and interactive way.”
The biggest benefit of the map is that it is a one-stop shop on broadband access for consumers, businesses and policymakers, Neville said. “Broadband drives economic growth and innovation, so data on America’s broadband capabilities are of increasing importance.
"And the National Broadband Map is the largest dataset of its kind,” she said. “Everyone starts at our homepage and from there consumers can look for what’s available to them in their neighborhood while policymakers can view the maps or the Analyze section to better understand how their regions compare to others. We need to understand where sufficient broadband exists in order to address where it is lacking.”
NEXT STORY: Microsoft's tablet begins to Surface


