In-house analytics tool maps fraud at USPS

The Postal Service inspector general's office built its own data analytics tool -- the Risk Assessment Data Repository -- to help investigators identify high-value targets for audit and investigation, reducing the time required to close a case and increasing the amount of money recovered.
Data is the raw material with which investigators deal. The challenge for them often is not so much getting data—there is more of it being produced and stored by government today than ever before—but making sense of it.
The inspector general’s office at the U.S. Postal Service has developed its own system to analyze data and visualize results, identifying high-value targets for potential fraud investigations. The core of the Risk Assessment Data Repository (RADR) is a suite of models that merge data from a variety of sources and score it on the likelihood of fraud.
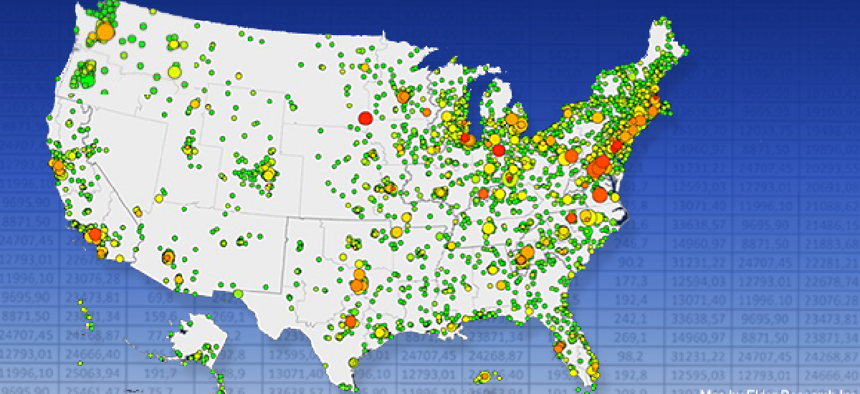
The resulting hotspots are displayed on a geographic interface. Armed with this analysis, examiners can proactively launch investigations rather than waiting to receive reports of wrongdoing.
The concept is not new. OIG investigators have been analyzing data on Excel spreadsheets for years. What RADR brings to the game are the data models that automate analysis for specific types of fraud and display results, letting investigators drill down for details where suspicious trends are shown, said Bryan Jones, deputy assistant inspector general for analytics.
“Once you have the data and have modeled it, if you ask a different question of it you get a different answer,” Jones said. “We ask a lot of different questions depending on what we’re looking for.”
The results of the system are positive, Jones said, but not easy to quantify. Most of the return on investment comes in cost avoidance. “When the investigators use our tools it takes them fewer hours to work a case,” he said. And early detection can reduce the amount of fraud.
There also are concrete returns in the form of recovery of funds. The analytics tool lets investigators prioritize high-value cases so that the average amount of money recovered on a case now is about $1 million. Overall, RADR more than pays for itself each year, Jones said.
RADR was developed in-house, using the subject matter and technical experts within the OIG working with a contractor to develop algorithms.
“We knew what we wanted and we used the skill sets we had,” Jones said. “We didn’t want to spend a lot on it.”
Work on the project began in 2009, and it took about nine months to build the first model, which examines worker compensation records for fraud. “We approached it like a small business,” Jones said. “We didn’t have a lot of money or resources, so we went for what would give us the biggest return.”
RADR went live in October 2011. The healthcare model was the first to go into production and is the most mature of the four models now in use. The model pulls together data—both historical and current—from within USPS and from outside sources such as the Labor Department. The OIG analytics team used the historical data to “train” the model on what fraud indicators to look for. Factors including frequency of claims, frequency of treatments, amount of payments and the length of claims payments are scored according to risk.
Using geographic information system software from Esri, results are displayed on a map that depicts high-risk cases—those that have several high-risk factors—as red hotspots. Medium-risk cases are displayed in yellow. The size of the spot reflects the relative value of the case in dollar amount, so investigators can quickly prioritize a case both by risk and value.
The interface is Web-based, so investigators can query data from anywhere. “It gives every investigator the chance to be proactive,” Jones said.
Models also have been developed to evaluate contract and financial fraud, and last summer a model to analyze mail theft was introduced. The OIG is working with large commercial mailers such as Netflix to identify when and where mail goes missing and what to look for.
RADR’s success shows that a targeted data analytics program using in-house expertise does not have to be a major investment. But it is not perfect. Because the data being analyzed is coming from different sources, the OIG’s analytics team often has to clean it up and put it into a usable format. But the Data Accountability and Transparency (DATA) Act could change that.
Signed by President Obama on May 9, the DATA Act establishes governmentwide data standards for financial data. The Treasury Department and the Office of Management and Budget will establish standards for government financial data, with standardized data elements that are computer searchable and readable. This is intended to make the information more accessible to the public for analysis and also would be a boon to government investigators and auditors.
“It will help improve our capabilities,” Jones said. By putting data in a standard machine-readable format, “it will allow other agencies to more easily do what we have struggled to do.”


