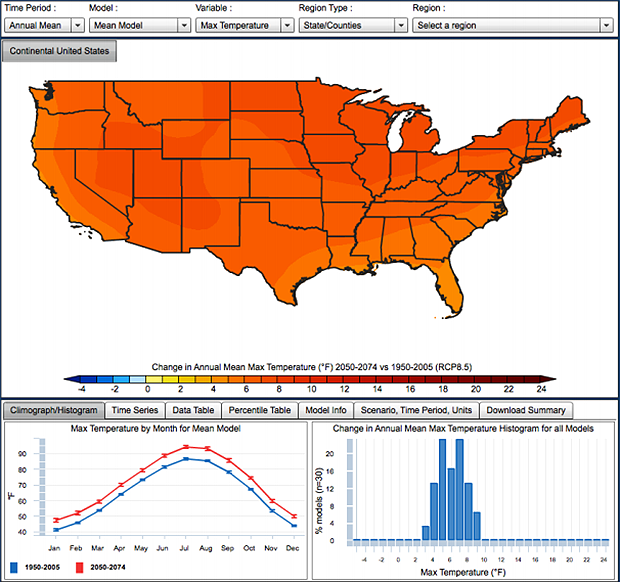
USGS Climate Change Viewer opens window on our future


Connecting state and local government leaders
The viewer visualizes data on projected changes in snowpack, soil moisture, runoff and evaporative deficit for U.S. states and counties.
"Want to see something really scary?" the demon disguised as a human asks before he reveals himself and consumes his companion in Twilight Zone: The Movie.
I was reminded of that scene when I jumped into the new USGS Climate Change Viewer and took a look at what was projected to happen to the snowpack in my home state of Washington over the next 90 years. By 2040, it would be 25 percent less than today. And by 2100, it would be virtually nothing.
The U.S. Geological Survey launched the Climate Change Viewer last December with temperature and precipitation data. Just last month, USGS added data on projected changes in snowpack, soil moisture, runoff and evaporative deficit for U.S. states and counties.
According to Steve Hostetler, a USGS hydrologist and one of the developers of the Climate Change Viewer, the original temperature and precipitation data comes from NASA, while the climate change models that are applied come from IPCC’s (Intergovernmental Panel on Climate Change) Fifth Assessment Report.
The Flash-based viewer offers an initial view of the entire continental United States, though users can zoom into individual state or counties. Alternatively, users can choose to work with watershed boundaries.
Seven variables are available for display: maximum temperature, minimum temperature, precipitation, snow, runoff, soil storage and evaporation deficit. And beneath the map, a row of tabs lets users drill down into and display the data underlying the map, including time series that project the chosen variable through 2100. That’s the scary stuff.

A PDF tutorial is also provided for those of us who may not understand the differences among the 30 mean models provided.
Hostetler and his colleague Jay Alder began building the viewer three years ago. "We started working with Fish and Wildlife Service and the Great Northern Land Conservation Cooperative," Hostetler said. "One thing led to another, and we decided we should actually put it into a viewer so that not only planners but also the public could access it."
Hostetler said there has been much positive response since the first release in December, which created a lot of public interest. "I think we are up to almost 150,000 maps being generated," he said. "The second release attracted more public interest but also more interest from federal agencies, states and universities."
Hostetler said planners are using the tool in order to plan adaptation and mitigation strategies in their jurisdictions. "Also, we do know universities are using it for teaching," he said. "It's an added way for people to look at climate change."
And the USGS itself is using the viewer and its underlying data for research. "We're starting to use the data for research," Hostetler said. "That's what we intended to do from the beginning."
NEXT STORY: Big data in Raleigh: Opening up and reaching out


