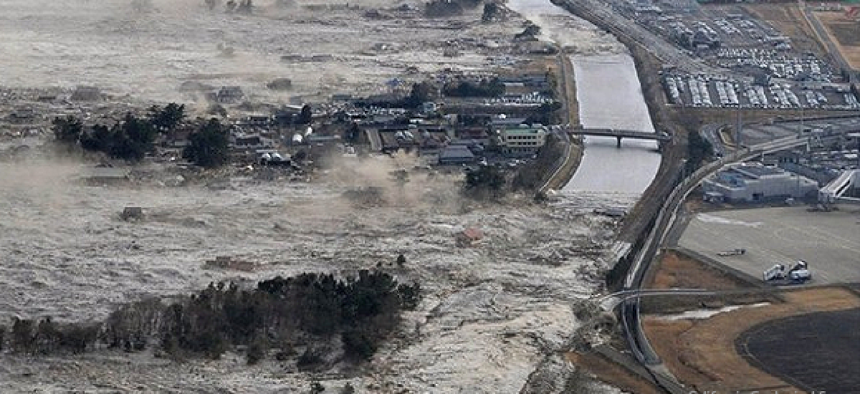
USGS software visualizes evacuation scenarios

Researchers with the U.S. Geological Survey have been working to create geographic information system software to assist pedestrian evacuation from sudden disasters.
The spate of recent natural disasters, from the 2011 earthquake and tsunami in Tohoku, Japan, to this year’s mudslides in Oso, Wash., have raised concerns – and the odds – that more people will need to evacuate a disaster zone at some point in their future.
Beyond the direct physical threats posed by such catastrophic events, their shifting, unstable geographies present serious challenges for public safety officials directing evacuees to safety. A path to safety can turn into a barricade – or worse – in an instant.
To confront these scenarios, researchers and developers working with the U.S. Geological Survey have been developing geographic information system software to assist pedestrian evacuation from disasters zones.
Due to the limited notice of the arrival of a hazard, evacuations are typically on foot and across the landscape, according to a research report on the development of the Pedestrian Evacuation Analyst (PEA), a tool for helping people find various routes to safety.
Researchers’ recent efforts have focused on a “path distance modeling approach that incorporates travel directionality, multiple travel speed assumptions and cost surfaces that reflect variations in slope and land cover.”
The tool, which has been installed in Esri’s ArGIS desktop advanced version, is intended to assess exposure to risk by evacuees and to help communities visualize evacuation scenarios from sudden-onset hazards, such as tsunamis.
“By automating and managing the modeling process, the software allows researchers to concentrate efforts on providing crucial and timely information on community vulnerability to sudden-onset hazards,” according to the report’s authors, Jeanne Jones, Peter Ng and Nathan Wood.
The software can calculate the travel time to safety from any location in a study area, determine the population in the evacuation zone, automate the processing of evacuation procedures and map various populations of residents, employee and dependent-care facilities.
The model gauges possible evacuation scenarios based on elevation, direction of movement, land cover and travel speed and creates a map showing travel times to safety (a time map) throughout a hazard zone.
The app also shows a view of the evacuation landscape at different pedestrian travel speeds. Data on the size and location of different populations within the hazard zone can also be integrated with time maps to create tables and graphs of at-risk populations, according to the developers.
Among potential data graphics considered for the app are a chart showing the “percentage of population to reach safety,” which shows the percentage of a population to reach safety before a tsunami, and a “population as a function of travel speed chart,” showing a group’s ability to reach safety at different travel speeds before the arrival of a tsunami.
The initial release of the software features a simplified design geared toward a researcher analyzing a single study area, according to the USGS report. That means future upgrades to the tool might include adding the ability – including expanding the time map – in order to compare or aggregate multiple scenarios.
“It is hoped that this tool will assist hazard research both within the U.S. Geological Survey and in the wider research community, providing valuable information on strategies for minimizing loss of life in catastrophic events,” according to the paper.


