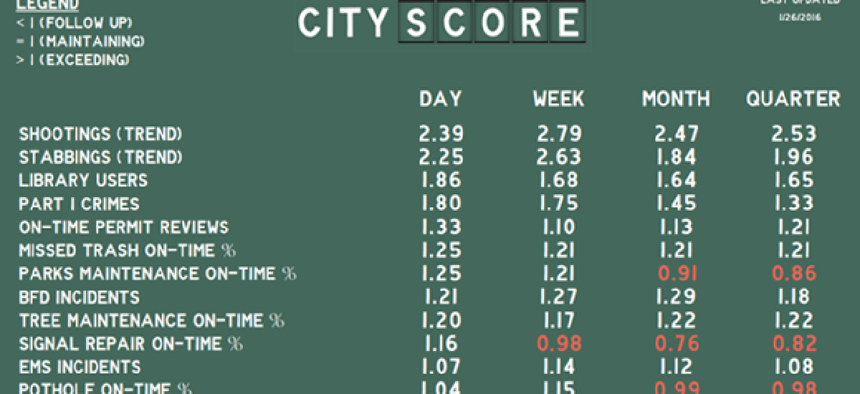
Boston’s CityScore tracks runs, hits and errors in service delivery


Connecting state and local government leaders
The CityScore analytics dashboard gives Boston officials and residents a Fenway-inspired way see metrics on city performance.
Residents and city officials in Boston who want to know the score when it comes to city services can now check CityScore, a baseball-themed online scoreboard that uses data from across departments to provide a single performance measure of the city’s health.
CityScore grew out of the Mayor’s Dashboard, which was created two years ago by the Department of Innovation and Technology to give city officials a visual way to track metrics and view agency performance. Afterwards, the team built similar dashboards for department heads so that they could see the information important to them, said Christopher Dwelley, citywide performance manager. “That is what we pulled out to put into the first iteration of CityScore,” he said.
Built by the Citywide Analytics Team, CityScore aggregates metrics from across Boston city government. The scoreboard so far includes scores on public safety, economic development, education, innovation and technology, health and human services, basic city services and constituent satisfaction.
Scores are determined by comparing the current performance to either a declared target or historical performance average. Scores above 1 mean the city is “exceeding” targets or historical averages; and scores below 1 mean the city is falling short. City staff can use this information to monitor the delivery of city services, make better decisions, identify areas needing improvement and track trends over time.
Residents, meanwhile, can check a streamlined, public-facing version of CityScore to see how government agencies doing delivering various services, in near real-time. All the individual metrics are averaged into a single overall city score.
The two “scoreboards” give site visitors easy access to the city’s performance data, Dwelley said. “We try to make sense of that in a way that’s really understandable to people without having to do a lot of analysis or digging.”
CityScore uses a backend SQL server that feeds data into Tableau Software and builds the visual representation, according to Stefanie Costa Leabo, a Boston performance analyst and one of the builders of the tool.
And while the Mayor’s Dashboards feature traditional performance indicators with bar, fever and pie charts, CityScore uses the fonts and colors of the old-school scoreboard in Fenway Park’s “Green Monster.” According to Leabo, the idea for the Red Sox-inspired design came from Daniel Koh, the mayor’s chief of staff.
In a TedTalk explaining the origins of CityScore, Koh talked about how baseball analytics have grown from just batting averages to include statistics such as on-base percentages, service-level percentages or wins above replacements (how many wins a player delivers compared to his replacement player in that position).
Similarly, Koh said, dashboards like CityScore are "a way of taking all the amazing work are doing and allowing us to know what’s going on in real time.”
More detailed information is available to city officials through the backend and through the departmental dashboards that feed data into CityScore. Information tracked includes the total tons of recycling collected, number of potholes fixed, the percentage of sidewalks repaired on time and other key metrics. These statistics are formulated and calculated into a single-digit score depending on area of focus, city targets and historical data, and then posted to CityScore.
Before its official debut, CityScore had its warm-up with the Public Works Department and the Department of Transportation. Chris Osgood, the city’s chief of streets who oversees the two departments, was able to use the scores related to services provided by his office to see where improvements were needed, Leabo said.
This CityScore launch is just the first iteration of the platform. The team is looking to add more metrics and incorporate additional data to make the score as representative of the city as possible, Dwelley said. Plans include adding lists of goals and targets, descriptive data and ways for the public to drill into the data.
“The concept of how CityScore works has already been proven in the piloting phase, so I think it’ll just be a matter of time before we can point to those performance improvements going forward,” Leabo said.
Boston intends to open-source the CityScore code so that other cities can leverage the concept.
NEXT STORY: DHS tests E-Verify app


