Iowa fights snow with data


Connecting state and local government leaders
Besides being a hit with the public, the state’s Track a Plow website gives the Department of Transportation and other agencies near-real-time information so they can quickly make data-driven decisions.
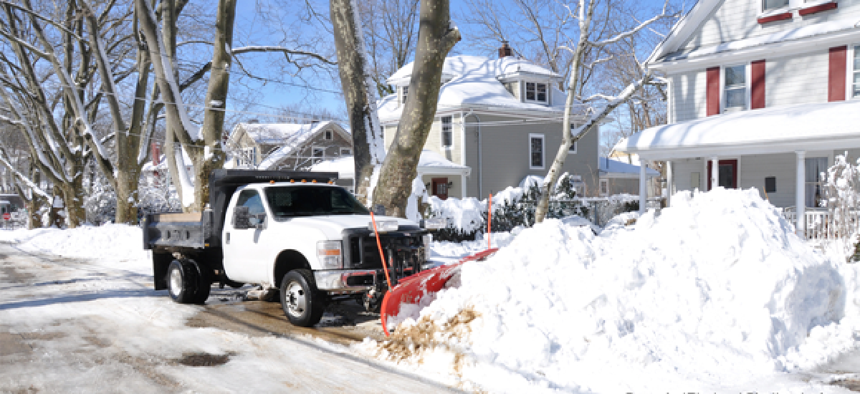
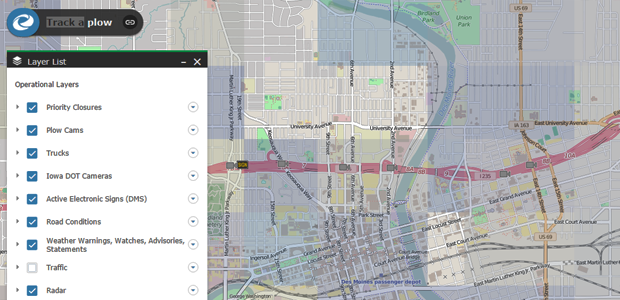
Most residents of the Mid-Atlantic states, now digging out from the recent record-setting snowstorm, probably don’t know how soon their streets will be clear. If they lived in Iowa, however, they could simply go to the state’s Track a Plow website to see in near real time where snow plows are and in what direction they’re heading.
In fact, the Track a Plow site -- the first iteration of which launched three years ago -- shows much more than just the location and direction of the state’s more than 900 plows. Because they are equipped with geolocation equipment and a variety of sensors, the plows also provide information on road conditions, road closures and whether trucks are applying liquid or solid materials to counter snow and ice. That data is regularly uploaded to Track a Plow, which also offers near-real-time video and photos of conditions.

According to Eric Abrams, geospatial manager at the Iowa Department of Transportation, the service is very popular and is being used for a variety of purposes. “It’s been one of the greatest public interface things that DOT has ever done,” he said. In addition to citizens considering travel, Abrams said the, site’s heavy users include news stations, freight companies routing vehicles and school districts determining whether to delay opening or cancel classes.
How it works
While Track a Plow launched with just location information, it has been frequently enhanced over the past two years, beginning with the installation of video cameras. “The challenge was to find a cost-effective way to put cams in the plows and then get those images not just to supervisors but to the public,” Abrams said. The solution he arrived at was dashboard-mounted iPhones that transmit time and location data in addition to images. These were especially cost-effective because they were free with the department’s Verizon data plan. “Our IT division built a custom iPhone app that is configurable for how often it sends pictures back to headquarters here, where we process them and get them out to the feed,” he explained.
According to Abrams, sensor data has also been added to the system, including air temperature, road temperature, the types of material that are being spread by the trucks and engine performance data. “So when an engine light comes on, a mechanic can diagnose it remotely,” Abrams noted. There are even sensors to detect whether the plow blade is up or down.
The data is all uploaded automatically to Amazon Web Services. From there, DOT servers retrieve the data once each minute and feed it into an Oracle database. Safe Software’s FME data integrator software is used to analyze the data, and the information that will be made available to the public is then ported to a KML file (an XML-based format used to display geographic information) that is then uploaded to Windows Azure. From that point, Esri’s ArcGIS Online is used to grab the KML data and build the online map, which updates on the Track a Plow website at regular intervals. In fact, the data that appears on the site is, with very few exceptions, only two minutes old.
In addition to informing the public, Abrams said, the enhanced system “allows supervisors to understand what their trucks are doing and to make adjustments in real time.”
Abrams said, the data feeds are being widely used outside of DOT as well. Iowa’s Homeland Security Department is porting the data feed to its operational maps, as is the state police. Even the Department of Natural Resources uses DOT’s Track a Plow photos to determine when to send out personnel to, for example, count wildlife.
Next steps
Abrams’ team isn’t finished with improving Track a Plow. Abrams said his office expects to release a new layer in January that will display cost information for storm-response efforts in real time. “The site will tell you the total amount of costs -- including labor and depreciation on equipment -- per mile,” Abrams said. “That will allow discussions with the public about what it costs to plow.” He added that the team is also working to develop the capability to run potential scenarios so that users can see what it would cost to bring speeds on a road back up to average.
“If legislators start saying, ‘We want to drive five miles an hour faster during this type of storm,’ well here’s what it would take to do that,” Abrams said. “There’s no one else I know that is doing this.”
Another feature the team is working to incorporate is salt inventory automation, which would allow supervisors to see at a glance the current supply levels. Finally, the team is looking to upgrade the frequency of data collection from once a minute to once every 15 seconds.
According to Abrams, the principle his team is following is, “Create once, use many times.” At the same time, he advised, agencies can get a lot more out of their big data efforts by keeping them database centric and software neutral. “If we can get our stuff into enterprise databases and don’t tie them down to application-specific schemas, we can make them available to any application that wants it,” he said.
NEXT STORY: Army wants 4G LTE for warfighter network


