Mapping Zika: GIS powers mosquito surveillance and control


Connecting state and local government leaders
Applying geographic information systems to vector-borne disease surveillance and control allows agencies to effectively allocate surveillance and treatment resources.
It’s summer, and in countless counties across the nation the annual fight against mosquitos is underway. This year, however, controlling the mosquitos has taken on greater urgency because of the very real threat posed by the Zika virus and its complications. And while Zika is certainly attracting the bulk of attention this year, the American Mosquito Control Association warns that over 1 million people worldwide die every year from mosquito-borne diseases such as malaria and viruses such as yellow fever, dengue, Chikungunya, West Nile and Zika.
When vector-borne disease outbreaks occur, fast, effective response protects people from infection. Traditional integrated pest management programs provide the vital functions of prevention, surveillance and control activities. However, yesterday’s approach is not going to cut it this year. Teams need better insight in mosquito populations -- where they are and how successful treatments have been.
Disease prevention begins with education. Everyone can play a part in reducing the number of common vectors, such as mosquitoes, if only they have the right information at the right time. Location intelligence can ensure that messages and resources are targeted where they are needed the most.
How can a location platform help prevent mosquito-borne disease?
Place matters when working to control vector populations and disease spread. Where were traps set? Which samples tested positive? How can call centers verify the locations of public reports of dead birds or green pools? Where should field staff be deployed? Where are pesticide treatments needed? Are there populations near treatment zones? All of these questions and more are implicitly spatial in nature, so it makes sense that a location platform can help.
With geographic information systems, teams can integrate data from multiple databases and generate findings visually. Instead of combing through row after row of Excel data generated by field reports, they can quickly generate insight from location data using data visualization capabilities. Once the initial “picture” is developed, GIS applications can further supplement the existing map view by integrating new or additional data sources. The ability to quickly supplement new data and conduct additional analysis enables agencies to detect patterns and trends that might otherwise be missed. By linking data through common geography, users can leverage dynamic maps to provide decision makers and the public with lifesaving information efficiently and effectively.
For example, applying GIS technology toward vector-borne disease surveillance and control allows agencies to address some of their toughest challenges: where things are happening, how the disease spreads geographically and how to allocate limited resources across a region to perform surveillance and treatments.
Location adds a key dimension
Across the United States, many different organizations and agencies are tasked with protecting the health of residents by managing operations to control mosquitos. Vector control districts employ skilled and dedicated staff to help reduce the mosquito population by conducting site inspections, placing traps, treating breeding sites with larvicide and, if necessary, fogging adult populations. Vector control districts are, in most cases, not large operations with multiple staff. The ability to use a location platform helps enable these small teams to be more agile, allowing them to make the most of the data they are able to collect.
One example is Santa Cruz County, which is located on California’s central coast. More than 14 species of mosquitoes call the county home, and the resources required to control the populations are significant. Santa Cruz County Mosquito Abatement and Vector Control (MAVC) started using GIS technology in the late 1990s to identify potential breeding sites based on ground conditions and proximity to water. Locations of standing water were mapped, and the area calculated for proper larvicide application. The data collected in the field was entered into a treatment database that included the type and amount of chemical applied, the area treated, the application date and the current condition of the site. To date, over 2,500 potential breeding sites have been mapped and are inspected on a biweekly or monthly basis.
MAVC also uses mobile data collection to map additional breeding sites and trapping locations in the field. This has proven invaluable because it saves time and improves the accuracy of the maps. The team is also able to map trails to breeding sites so field staff can quickly identify best routes and even avoid spots where poison oak has been seen and noted.
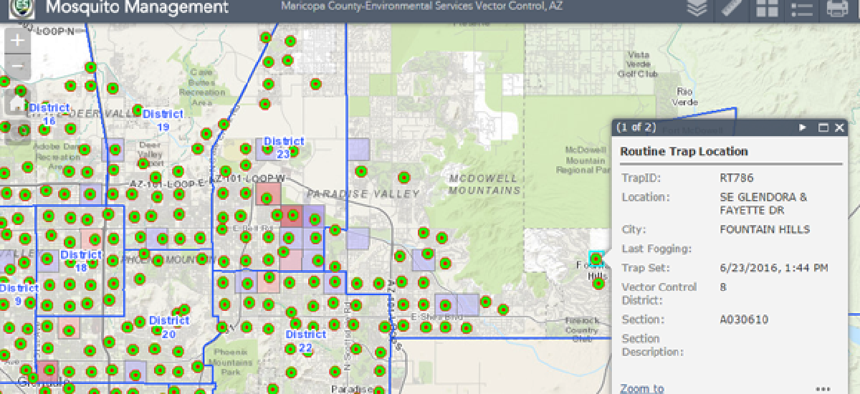
In Arizona, Maricopa County Environmental Services also leverages location intelligence to educate, survey and perform vector control. Using an interactive map, residents can see routine trap locations in more detail, including the last fogging date, when a trap was set, which control district it is in and a description. Providing information through interactive maps is an easy way to increase the public’s understanding.
While Zika is the vector-borne illness that is top-of-mind right now, it is important to remember that these illnesses occur frequently and require an agile approach from control teams to keep them in check. Integrating technologies like GIS into control efforts can help communities move beyond traditional measures and ultimately helps to keep the citizens they serve better protected.
NEXT STORY: Zombie Invasion: Rethinking Undead Mobile Apps


