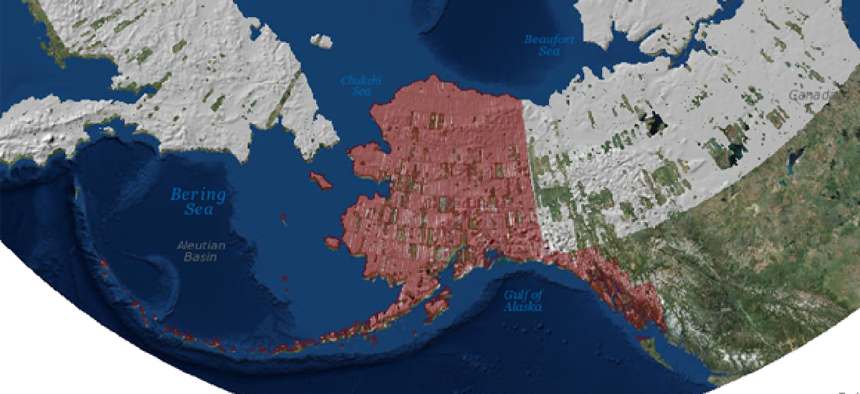
3-D, high-res maps of the last frontier

Topographic maps of Alaska will help researchers studying a range of issues, such as ice loss, glacial changes and surface water flow.
The public release of the first unclassified 3-D topographic maps of Alaska will aid researchers in studying a wide range of issues, including ice loss, glacial changes and surface water flow.
The computer-generated maps (otherwise known as digital elevation models, or DEMs) were developed by the National Science Foundation, the National Geospatial-Intelligence Agency and a number of academic and private sector partners. Models of the entire Artic are scheduled to be released in 2017.
The maps are the first to be released by the ArcticDEM project, created after a January 2015 executive order to improve decision making in the region. Image data for the maps comes from commercial satellites owned and operated by Colorado-based DigitalGlobe. The data is then fed into University of Illinois’ Blue Waters supercomputer.
Using algorithms developed by software collaborators at Ohio State University, Blue Waters constructs 3-D images based on comparisons of stereo pairs of two-meter resolution imagery from DigitalGlobe satellites.
The new maps, available on an open public portal, have a resolution of five meters or less; current elevation models for the Artic have a resolution of one kilometer. The project marks the first high-resolution, high-quality and openly distributed set of DEMs of all Arctic landmasses above 60 degree north, according to the University of Illinois.
“This is quite an astounding thing to be producing topography for 30 degrees of the globe with supercomputers and one-foot resolution satellites,” said Paul Morin, head of the University of Minnesota’s Polar Geospatial Center (PGC) and part of the ArcticDEM project, in a statement from the University of Illinois. “I’ve never seen anything like it.”
The Arctic is remote and its weather is sometimes harsh and unpredictable. As a result, collecting such detailed images were not previously possible, due to logistics and costs. Not only is collecting images from satellite easier and more cost-effective than using aircraft, but the DEMs can be produced at regular intervals — weekly, monthly, or annually — to observe and document changes as they occur.
“Each day the satellites collect image data over an area equivalent of California in the Arctic. Over a period of a week PGC can receive up to 30 terabytes of data,” the university said.
The new maps will provide information about “ice and volcano interactions, process geomorphology, tectonic geomorphology, plate boundary interactions, fault expressions, fault evolution, glacial geomorphology, and solid earth geodynamics derived from bending lake shorelines,” according to the university.
The data will be used in the study of microclimates, anticipating and addressing permafrost impacts and rising sea levels, potential storm-surge effects from rising water levels, wildlife and ecosystem management as well as disaster management for Arctic coastal communities.


