Mapping the ocean with three dimensions of data


Connecting state and local government leaders
Esri’s ecological marine units open up government data on physical and chemical conditions in the oceans for ecosystem-based research and management.
This month, 50 years of data collected from oceans around the world -- salinity, temperature, oxygen levels and nutrients, mapped by location and depth -- was released to the public along with tools to help researchers make better use of the data.
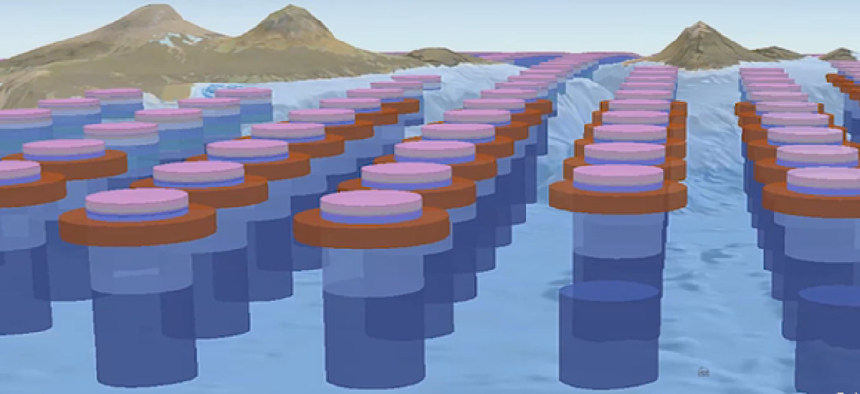
Working number of government agencies, including the U.S. Geological Survey and the National Oceanic and Atmospheric Administration, geospatial data company Esri mapped 37 physically and chemically distinct volumetric regions or ecological marine units (EMUs) that provide a 3-D perspective of the ocean's complexity.
The underlying data is derived from NOAA’s World Ocean Atlas, a compilation of millions of measurements that have been collected from a variety of platforms, including NOAA’s own buoys and a worldwide network of battery-powered Argo devices. The Argo project, an international effort, currently maintains more than 4,000 anchored Argo floats that measure temperature and salinity to a depth of 2,000 meters. That data is uploaded to satellites when the floats reach the surface.
The raw data of the World Ocean Atlas has long been made available by NOAA in four formats -- ASCII, CSV, ArcGIS and NetCDF. The EMUs are 3-D data clusters containing data on six variables: temperature, salinity, dissolved oxygen, nitrates, phosphates and silicates. The result of the analysis was 37 discrete different kinds of EMUs in the ocean. One EMU might be, for example, “warm, low-saline, low-oxygen, high-nitrate, low-silicate and high-phosphate.” The data in those EMUs can provide information about species distributions, biogeographic realms, seabed habitat and the response of these ecosystems to influences such as ocean acidification.
While the World Ocean Atlas has provided much of the data to researchers, the EMU’s are easier to access and will be more useful. “The tool that the EMUs represent allows access to the World Ocean data in a much more useful format for those end users,” NOAA’s Chief Scientist Rick Spinrad said. “We certainly will make much more use of the data within NOAA thanks to this tool as well.”
In all, the global map of EMUs is comprised of 52 million points, with measurements taken on the surface at each quarter degree (roughly 27km by 27km) and at up to 102 different depths. NOAA has committed to updating the datasets every two to three years.
“We consumed all the data that [NOAA] had been maintaining for 50 years,” said Sean Breyer, Esri's program manager for ArcGIS content. “We want to take the combination of these variables and define the most distinct groups that should be put together.”
According to Spinrad, the data will soon be expanded, both in depth of collection and in types of data collected. Currently the Argo floats only reach a depth of 2,000 meters and have been limited in the types of sensors they can carry, Spinrad said. NOAA is planning to expand its reach with ‘Deep Argo,’ which will go down to 6,000 meters, and biogeochemical sensors as well. “So were going to see an expanded and diversified set of data coming in,” he said.
The data will be available both through the EMU web app as well as through Esri’s ArcGIS Pro platform. “The Pro product will allow you to see and visualize the entire data in three dimensions, to do fly-throughs to look at it from oblique angles,” Breyer said. The analyzed EMU data is also available in ASCII format for use on other platforms.
While the data can be brought into other platforms, Esri Chief Science Officer Dawn Wright said there are advantages to using it in ArcGIS. “One is that there is a connected online version so that as updates become available, you’re always getting updates and corrections as opposed to downloading the file,” she said. “We’ve also created a 2D viewer that lets you move around anywhere in the ocean and select those quarter-degree locations and then build a vertical profile of the water column so you can look at salinity through depth of the specific location or temperature.”
According to Wright, in addition to enhancing the depth and types of data collection, the next step is to apply EMU to coastlines. That, she said, will require higher-resolution data collection.
In the very near term, Spinrad said he looks forward to the impact EMUs will have on fisheries management. “A tool like the EMU starts to define the environment that may characterize how to manage the fish much more consistently with the way that Mother Nature actually structures that particular distribution of fish,” he said. “So we look to this as part and parcel of the move toward ecosystem-based management.”
NEXT STORY: OMB issues new guidance for websites


