Land Cover Data for the Chesapeake Bay Watershed Just Got Way Better

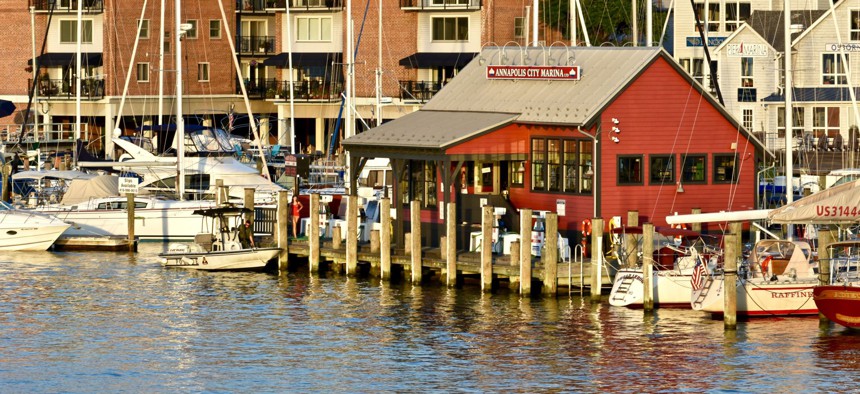
Annapolis, Maryland Shutterstock
New high resolution data for six states and Washington, D.C., is seen as a boon for efforts to cut down on pollutants in the nation’s largest estuary.
New geographic data for thousands of square miles in the Chesapeake Bay watershed will provide 900 times more detail than had been available about the landscape around the ecologically significant estuary.
Completion of the Chesapeake Bay High-resolution Land Cover Project was announced Tuesday by the Chesapeake Bay Program, a regional partnership involving states and the federal government. The high resolution data is expected to be valuable for ongoing efforts to limit the amount of pollutants that end up in the bay, according to the Bay Program.
Stretching about 200 miles between Havre de Grace, Maryland, and Virginia Beach, Virginia, Chesapeake Bay is the nation’s largest estuary—a body of water where freshwater and saltwater mix. Its ecosystem supports more than 3,600 species of plants and animals.
The watershed that feeds the bay spans areas in six states and the District of Columbia, ranging from Cooperstown, New York in the north, to Norfolk, Virginia in the south.

Analysts worked for about 10 months to create the new land cover dataset for nearly 100,000 square miles in the watershed's jurisdictions.
During the process, high resolution images captured from aircraft were transformed into a “land cover classification dataset”—which can be viewed in map form and also used for analyses that incorporate statistics and math.
The dataset categorizes natural and manmade features, such as buildings, trees and water. This information is at a one-by-one meter resolution. That’s compared to conventional land cover data, which has a resolution of 30-by-30 meters.
Land cover data resolution has been “a bottleneck for all kinds of analysis,” according to Jeffrey Allenby, director of conservation technology for the Chesapeake Conservancy, an Annapolis, Maryland, based nonprofit group that helped spearhead the land cover project.
Allenby explained that 30-by-30 meter resolution represents about a quarter-acre on the ground.
When a computer interprets data with this level of granularity, he said, it is “basically saying everything within this quarter-acre is something, whether that’s agriculture, or a forest, or medium density development. But you didn’t have any detail beyond that.”
A suburban neighborhood, or the edge of an agricultural field, might be classified as simply “developed,” but it would not be possible to know what percentage of the area is houses, roads or sidewalks.
“We’ve improved the resolution by about 900 times,” Allenby said. “You’re getting down to individual trees,” he added. “It’s giving you a better idea of what is actually in the landscape.”
This fine-grained information is expected to help inform an assessment process, scheduled for next year, to measure the progress of jurisdictions in the Chesapeake Bay watershed toward curbing the amount of pollutants that are flowing into the estuary.
The six states in the watershed include: Delaware, Maryland, New York, Pennsylvania, Virginia and West Virginia.
New land cover data is available for each of them.
Chesapeake Bay restoration efforts date back decades. Over the years there have been serious concerns about contamination, habitat loss and over-harvesting of sea life. Pollution threats to the bay include runoff from sources like agricultural fields, sewers and streets.
In addition to providing a crucial wildlife habitat, the bay is important economically. According to the Chesapeake Bay Foundation, about 500 million pounds of seafood come from its waters each year, including oysters, blue crabs and striped bass. Recreation and tourism also help drive the economies in bay communities.
Working with the Chesapeake Conservancy on the land cover data project was the University of Vermont. A company called Worldview Solutions, Inc. completed work for the initiative in Virginia. Allenby estimated that the project all together cost about $2.5 million.
Images used to produce the data came from the National Agriculture Imagery Program, which is administered by the U.S. Department of Agriculture's Farm Service Agency.
With the methodology for creating the dataset established, Allenby said there are discussions about how to produce similar information for other places. “We’re talking with companies like Microsoft," he said, "about leveraging cloud computing and saying: ‘could you take this nationwide?’”
The data from the current project is freely available to the public and Allenby emphasized that it would likely have value for state and local governments. “They can use it for any number of tasks,” he said. Updating comprehensive plans was one possibility he mentioned.
“I don’t think we’re going to fully know the true benefits and implications of the data for probably three or four years,” he added, "as people start to use it.”
Bill Lucia is a reporter for Government Executive's Route Fifty and is based in Washington, D.C.
NEXT STORY: Quantum computing: Probable solutions incredibly fast


