Data USA adds new functionality

The ability to download and compare data makes it easier to work with public data.
When data researchers at Deloitte, MIT and Datawheel launched Data USA in April 2016, they wanted to bring data from the Census Bureau, the Bureau of Economic Analysis and the Bureau of Labor Statistics into a single website with visualization tools to help data analysts create compelling stories. But they soon realized they needed to add more functionality into the site, such as the ability to download datasets and make year-over-year comparisons.
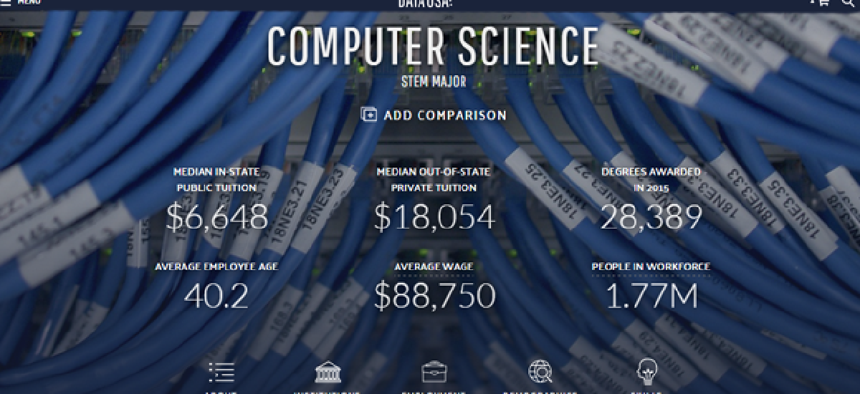
Data USA 2.0, which officially launched on June 26, overhauls the site’s homepage, adding links to specific categories and stories to pique user interest on various topics such as high-school graduation rates by state, population by county and adult smoking trends by state. Users can drill into the sample topics or search the site for locations, industries, occupation and education and see the data through interactive maps and charts that can be downloaded, embedded and shared. Data is also available through application programming interfaces.
"2.0 builds on the theme of integrating more data with a lot of health information and health care data added into the site," Matt Gentile, principal and analytics leader at Deloitte, told GCN. "By adding in the capability to see the visualizations on our site and download them for your own use, it provides a whole new level of interaction where you can not only see what the data looks like in a map or chart, but also vacuum it down for your own use."
Information on Medicare services at the national, regional and local levels were added to Data USA from the Dartmouth Atlas of Health Care. The new datasets allow users to focus their research down to the hospital and associated physician level to find patterns around health care coverage and specific diseases.
New functionality was also added to give visitors the ability to compare various datasets on economic indicators, health and safety, demographics, education and housing by city and county. Each city or locality page has an introduction with basic information on population size, median household income and nearby municipalities.
The work done on Data USA has been a collaborative effort among Deloitte, MIT’s Media Lab and Datawheel, Gentile said. Deloitte took on the responsibility of preparing some of the datasets for publication and working to integrate the data across various domains. MIT’s Media Lab and Datawheel added functionality to the site and refined the design.
Data USA integrates data from the American Community Survey, ACS Public Use Microdata Sample, Bureau of Economic Analysis, Bureau of Labor Statistics, the University of Wisconsin County Health Rankings, Dartmouth Atlas of Health Care, the Integrated Postsecondary Education Data System and O*Net Skills. As part of the 2.0 version, developers are adding more historical data from the surveys as well.
"Each of these datasets has their own update cycle, and our commitment is to bring the most up to date version of each of these datasets and integrate it into the site," Gentile said. "We are slowly working backwards to put in the historical data in for context and enrichment."


