Virginia maps opioid response


Connecting state and local government leaders
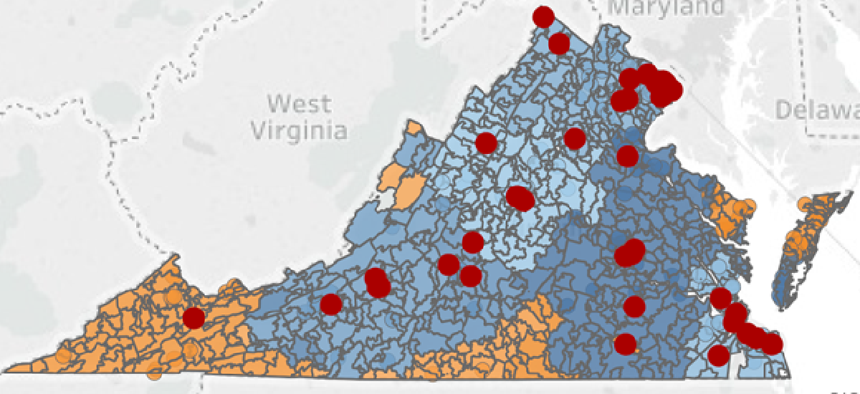
Color-coded heat maps show gaps in addiction treatment coverage so decision-makers can recruit more providers and push community outreach.
The Virginia Department of Medical Assistance Services, which administers Medicaid and the State Children’s Health Insurance Program, is using data visualizations to tackle its response to the opioid addiction emergency in the commonwealth.
By reviewing color-coded heat maps of the 1,200 Virginia ZIP Codes, decision-makers can immediately see gaps in addiction treatment and begin to fill them by recruiting more providers and pushing community outreach.
“Instead of doing generalized policies across the state, it helps us to do outreach in reference to particular areas,” said Bhaskar Mukherjee, director of DMAS’ Office of Data Analytics. “Month over month, slowly the green portions -- portions with adequate coverage -- are growing across the state.”
Earlier this month, President Donald Trump declared the opioid crisis in America to be a national emergency. In Virginia, the number of people who have died of opioid overdoses rose from 515 in 2007 to 1,138 in 2016, and the Virginia Department of Health expects the total to grow by about 30 deaths this year.
The maps, which show the adequacy of Virginia’s Addiction and Recovery Treatment Services, are categorized by treatment levels set by the American Society of Addiction Medicine. The most basic level is intensive outpatient treatment, while in-hospital detox is the upper level. To earn a green score for a given level, a ZIP Code must have at least two providers who offer opioid addiction treatment at that level within 60 miles or 75 minutes’ drive time from its center point.
“If that condition is not met, we show this [area] as inaccessible,” said Melanie Boynton, senior policy and research data analyst at DMAS. “That then becomes a map that our implementation team looks at.”
The office uses data on providers, including the level of care they provide, and treatment in terms of encounters from Medicaid fee-for-service and managed care providers, although the department is moving to 100 percent managed care. The providers send their files to DMAS, where the data is scrubbed to ensure quality before it is moved inside the department’s firewall. Boynton accesses the data there and runs an application that the office developed for analysis.
The tool “takes that data, combines it with other data and then creates an output file that is then loaded into [SAS Visual Analytics]," Boynton said. DMAS sends decision-makers "maps and charts and different graphics that visualize the data for them so they see how things are going.”
The office also creates a dashboard once a month to show how outreach is progressing, what services are being used and why others are underutilized.
Currently, all that work is done manually, but officials plan to change that. Mukherjee said that because there was no precedent for doing this kind of work with Medicaid, buy-in was critical to the program’s success. Now that the DMAS operations team has seen the benefits, officials are developing a plan for automation, which he aims to have in place by year’s end.
Despite the human intervention, the process has drastically cut the time it takes to produce this information, Boynton said.
“Right now, the manual process from the time we get the files to the time we’re handing a result back to the people inside DMAS who need it is a day or two,” she said. “We’re going to get faster and faster as we get all these different pieces in place.”
DMAS began producing visualizations in January and applies the process to more than opioid addiction. It’s also used for the Family Access to Medical Insurance Security and the Managed Long-Term Services and Supports programs. As a result, the department can issue prior authorizations for services or prescriptions in a day, a process that used to take at least 30 days. DMAS also uses SAS Visual Analytics to share sensitive data departmentwide.
Looking ahead, Mukherjee said there are plans to use analytics to assess vendors. “This makes information readily available to management and decision-makers,” he said.
NEXT STORY: Using Twitter to Save a Newborn From a Flood


