Graph databases help agencies spot relationships across silos


Connecting state and local government leaders
The solution lets users connect data points among siloed datasets and applies machine learning so that their algorithms improve over time.
MissionGraph, the product of a new partnership between Deloitte and DataStax, is banking on the growing use of graph technology to analyze data at federal agencies.
One agency -- Customs and Border Protection, part of the Department of Homeland Security -- is already using MissionGraph, an interactive, cloud- and machine-learning-based tool that relies on graph databases to analyze and visualize vast amounts of operational data. “They’re using the MissionGraph solutions to look basically for bad actors,” said Matt Rollender, vice president of Global Business Development and Channels at DataStax. They’re trying to “find out what those relationships are between people, between where they might be moving, what they might be doing to try to make a prediction about what they might be trying to accomplish.”
DataStax defines a graph database as one “whose relations are well represented as a graph and has elements which are interconnected, with an undetermined number of relations between them.” Graph technology uses NoSQL, compared to more traditional or relational databases that use Oracle or MySQL. As a result, graph technology is better able to support real-time analytics and scale with an agency’s data structure.
Graph technology is gaining attention. According to Forrester Research, “51 percent of global data and analytics technology decision-makers either are implementing, have already implemented or are upgrading their graph databases.”
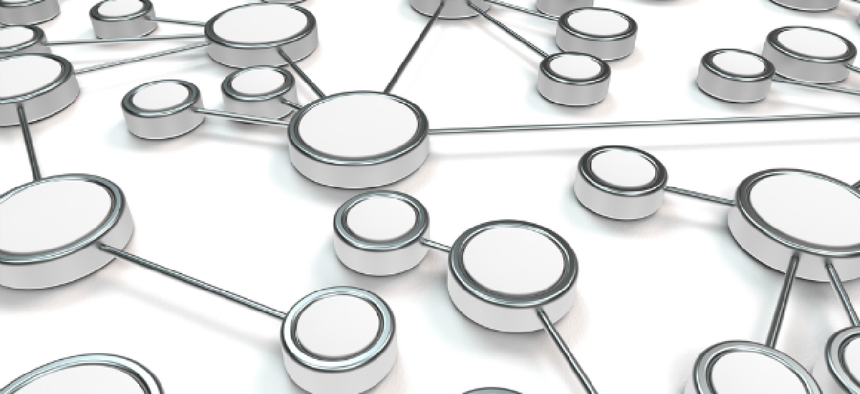
“The beauty of graph and graph technology is … it allows you to create and understand relationships between entities -- and those entities can be people, they can be things, they can be events, they can be places,” Rollender said. Graph technology is “overlaid on top of a data management system or built into a data management system. It gives you the ability to create those linkages and see what those relationships are between different data points and different entities.”
Deloitte developed MissionGraph on DataStax Enterprise (DSE) and DSE Graph. DSE is a data platform for cloud applications that lets users distribute and replicate data across data centers or clouds and scale accordingly. DSE Graph, powered by Apache Cassandra, handles large, complex, relationship-heavy datasets at an enterprise scale.
The solution lets users connect data points among siloed datasets and applies machine learning so that their algorithms improve over time. For example, MissionGraph can show events and patterns to predict when something unwanted might happen, or it can consolidate multiple versions of the same entity, such as contact information, across data sources.
“You can create these relationship charts that show the connectivity between people, things, events and places, and you can essentially then take that data that you have in those siloed internal sources and you can also connect that with publicly available data sources as well -- so think Facebook,” Rollender said. “You can see anomalous behavior and activity and use that to your advantage.”
MissionGraph can show relationships and associations among sophisticated networks, and it can link unstructured and structured data and open-source data. The a-ha moment comes when users see the graph, which they can share with other stakeholders.
“MissionGraph is really all about empowering the users of the solution to do rapid data discovery in near-real time,” Rollender said. That lets them make “actionable data-based decisions faster than they ever have before,” he said.
It can be hard for federal agencies to analyze data across diverse populations and siloed systems, he said. “The notion behind MissionGraph is really to be able to overcome that and to break down those silos and to overlay this technology onto the disparate data sources so they can get a really holistic view.”
Applicable at the state government level, too, MissionGraph can be used for a variety of use cases, including fraud detection and prevention as well as supply-chain management. Rollender said he expects to see the possibilities increase as more customers begin to implement the solution.
Deloitte and DataStax announced their partnership at the end of November.


