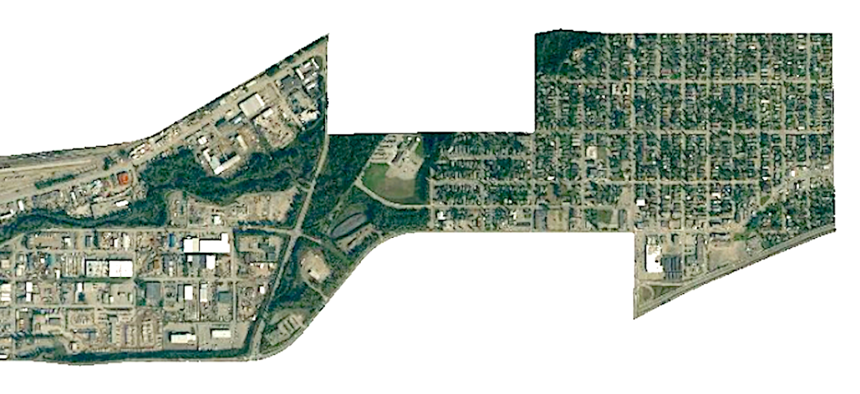
Highlighting Every Census Tract, One by One in Numerical Order

Census Tract 6 in Anchorage, Alaska Via @everytract / Twitter
Exploring U.S. geography through a jigsaw puzzle of community snapshots.
An automated Twitter feed that this winter started to feature every U.S. census tract in numerical order wrapped up its first state, Alabama, this week. Next up is the census landscape of Alaska.
To some, watching the jigsaw puzzle snapshots of America roll out on @everytract, one by one, might be as exciting as watching paint dry, but to demographers and U.S. geography geeks, it offers a different way of exploring the multitude of communities that make up the nation.
Here’s Census Tract 1 in the Aleutians East Borough:
This is the work Neil Freeman, an urban planner and artist who has created numerous interesting data, mapping and design projects over the years. (That includes redrawing U.S. state boundaries to achieve equal population and this tool that allows you to compare subway, metro and other urban rail networks around the world according to their actual size and not by their route maps, which often distort reality in the name of usability and design preferences.)
As the census-tract project has been playing out, Freeman, like an airline pilot pointing out cities and topographical points of interest during in-flight announcements, has been tweeting out occasional observations. That included one on March 14 where he pointed out the gold dome of the recently closed Mobile Civic Center in downtown Mobile, Alabama, which for those who want to explore the Yellowhammer State in greater detail, is in Census Tract 2 in Mobile County.
Beyond Freeman’s Twitter bot churning out the individual tract tweets, his data and mapping efforts at density.website allows users to search locations across the U.S. and pull up a variety of stats based on the census tract, mostly focused on population- and housing-density information.
Tract-level information from the U.S. Census Bureau can tell many interesting stories about a particular community. And with the recent look at the Anchorage area by @everytract, it’s worth pausing at Census Tract 6 in the Municipality of Anchorage.
This tract includes includes a swath of neighborhoods northeast of downtown Anchorage, including one called Mountain View, which Route Fifty visited last year.
While Freeman’s census-tract data tool doesn’t drill down into information on a tract’s racial or ethnic makeup—again, his work here is focused on population and housing density—this area of Anchorage might be surprising to some. It includes some of the nation’s most diverse census tracts, according to analysis work by University of Alaska sociology professor Chad Farrell in recent years.

In 2015, a CNN feature on Mountain View’s concentration of diversity looked at Farrell’s census data analysis. Why is Mountain View so diverse compared to other census tracts?
Farrell explains the index he used to measure diversity: He looked at the number of ethnic and racial groups, but more importantly, he studied their size relative to one another.
Farrell found that two things boosted Mountain View to the top. First, there is a sizable white population left. In many other places, neighborhoods that have increased in diversity have also seen white flight. Not so in Mountain View.
Mountain View also has a significant Alaska Native population, which other cities in America lack.
Mountain View’s proximity to military installations, including Joint Base Elmendorf-Richardson, also plays a role in the adjacent community’s diversity.

In 2014, as The Atlantic noted at the time, an analysis by data scientists Randy Olson showed that communities in Alaska’s Aleutian islands were among the nation’s most-diverse.
For what it's worth, when asked why he thought Alaska took the top spots, Olson suggested: "The Aleutian Islands have a fairly small population (~5000 people) and are home to several fishing ports in Alaska," he said. "Deadliest Catch comes to mind... perhaps such a dangerous job draws in people from all backgrounds to come work and live there?"
As the nation changes, our census geography changes with it. While the stream of @everytract Twitter snapshots isn’t going to present the full spectrum of census data available on a particular location, it is a good starting point to spark curiosity about places some people may not normally think about, like Alabama and Alaska.
As @everytract continues feature Alaska’s local geography, one thing is clear: There’s a lot more census-tract territory in the Lower 48, Hawaii and U.S. territories to go through and explore.
RELATED on Route Fifty:
Michael Grass is Executive Editor of Government Executive's Route Fifty and is based in Seattle.
NEXT STORY: Spectrum sharing moves ahead


