Mapping NYC's zoning processes

NYC Planning Labs builds interactive maps and open source tools to explain how New York City's zoning process works.
NYC Planning Labs was created in 2017 to help the Department of City Planning and the public understand how New York City's zoning process works through interactive maps and open source tools.
“The process for tracking zoning changes has historically been complex and hard to understand,” NYC Planning Labs Director Chris Whong said. “We are trying to make it easier for a person to determine what the steps are and what stage a project is in at a high level. … We see the mapping as the medium for everything that we do here because it is really what gives everything context.”
While the exact toolset can vary from project to project, NYC Planning Labs generally uses the Ember.js framework to create the apps and Mapbox GL for designing the apps on the front end. The team also uses PostGIS or Carto as the spatial database on the backend of the web-based applications.
The Planning Labs' new zoning application portal (ZAP Search) features specific information on every zoning project. Users can search zoning applications filtering by borough, project stage and community district. Other projects include ZoLa, NYC’s Zoning and Land Use Application, Community Profiles, Population FactFinder, Metro Region Explorer and the NYC Street Map. Each is designed to help residents, government officials and city planners understand different regulations, demographics and processes that surround the Department of City Planning.
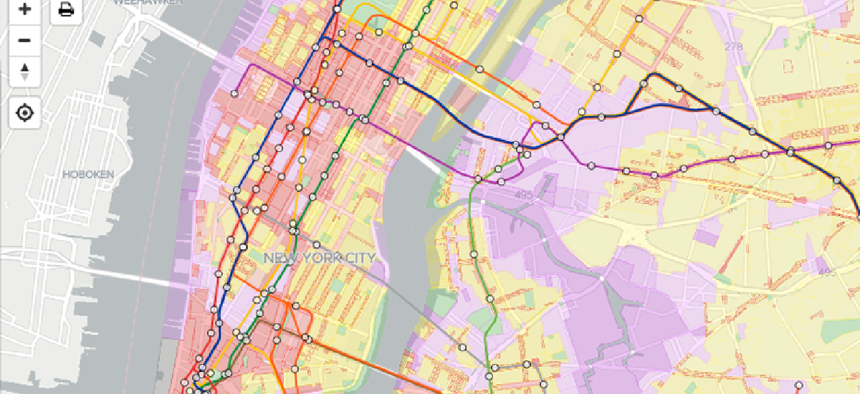
ZoLa gives planners, developers and the general public is a simple way to research zoning and learn about Department of City Planning initiatives in different boroughs.
Community Profiles offers a public gateway to data, maps and other resources in New York City’s 59 districts. Users can find information on buildings based on land use and zoning and learn about current land use applications and neighborhood studies.
Population FactFinder pulls data from decennial censuses and the American Community Survey so users can easily create detailed population profiles with demographic, economic and housing statistics for specific parts of the city and see how these statistics have changed over time.
Metro Region Explorer allows users to explore population, housing and employment trends within the New York City metropolitan area.
The NYC Street Map is an ongoing effort to digitize official street records, combine them with other street-level information and make them digitally accessible. The app allows users to find the official mapped width, name and status of specific streets and learn how the street grids have changed over time.
“We are changing people’s expectations of what can be built in-house,” Whong said. “We are trying to show how we don’t need to spend a lot of money or time to build software that is as good or better than what any other private-sector development team could build.”
The team consists of three civic technologists who work on projects in a four- to six-week sprint. The team is able to turn around quick results by working closely with the Department of City Planning to learn about their specific needs, Whong said.
“We based NYC Planning Labs off of the General Service Administration’s 18F [digital services shop] because we want to prove that we can do this type of work at a local level quickly and cheaply with a high level of success,” he said.


