Crowdsourcing King Tides to Better Understand Rising Sea Levels

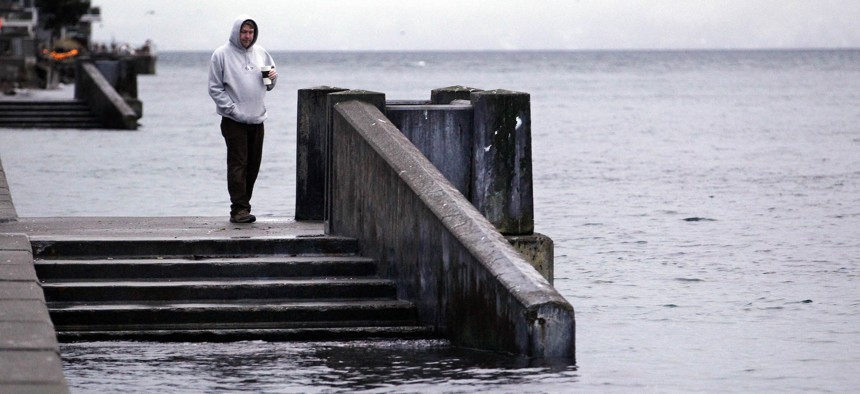
A pedestrian looks at stairs leading to water during the peak of a "king tide" Tuesday morning, Dec. 27, 2011, along Alki Beach in Seattle Elaine Thompson / AP Photo
In Washington state and Virginia, the public can help planners and researchers monitor the inundation of low-lying coastal areas.
SEATTLE — The broad concrete steps leading down into the waters along Commodore Park offer a good spot to watch boats go in and out of the nearby Ballard Locks at Salmon Bay, as well as keep an eye on seals and various birds feasting on the local marine life.
But for observers of the tides, it’s a good spot to monitor just how high the water can sometime go and catch a glimpse of the future, when higher sea levels will push those tides even higher. Here’s what the water looked like back on Nov. 11, 2017, when Seattle’s predicted high tide was 11.7 feet.
King tides are especially high tides that are amplified by astronomical events including the perihelion, when the Sun is closest to Earth in its orbit in early January. In low-lying coastal cities, like Miami Beach, Florida and Norfolk, Virginia, the highest tides of the year can bring flooding and give planners, local officials and the public a good opportunity to measure the incremental impacts of a changing climate.
But like all tides, they’re also influenced by local topography. Washington state has more than 3,300 miles of coastline, which includes the various islands and inlets that comprise Puget Sound and its adjacent waterways.
According to a tidal prediction calendar for Washington state, King tides will be happening in Seattle next from Dec. 25-27 and Jan. 23-25, rising to around 13 feet. (In December 2012, a storm-driven high tide sent water levels to a record 14.51 feet in Seattle.) In Shelton, a city that sits at the end of a narrow southwestern arm of Puget Sound called Hammersley Inlet, the tides will rise higher than 16 feet on those same dates next week and in January.
The Washington State Department of Ecology and Washington Sea Grant are encouraging the public to help researchers track the coastal impacts of King tides through a crowdsourcing effort where people can submit photos of high water along with location and time information. The photo repository is hosted on Washington MyCoast, a project of the Washington state Department of Natural Resources with support from the U.S. Geological Survey, Washington Sea Grant, Snohomish County Marine Resource Committee and Northwest Straits Initiative.

This recently submitted image, taken 14 minutes before high tide on Nov. 28, shows the waters of Puget Sound near the Chambers Bay Golf Course near Tacoma and note just how close the higher tidal levels get to the adjacent rail tracks. (Those tracks, owned by the BNSF Railway, provide one of the few freight rail links that connect the ports of Seattle and Tacoma to the rest of the nation.)
Another region where the public is encouraged to track the tides is the Hampton Roads area of Virginia which includes the low-lying cities of Chesapeake, Newport News, Norfolk and Virginia Beach.
“Catch the King,” as the program is known in Virginia, “aims to map the king tide's maximum inundation extents with the goal of validating and improving predictive models for future forecasting of increasingly pervasive ‘nuisance’ flooding.”
This year’s cross-sector collaboration focused on the King tide event that happened on Oct. 27, which organizers used as an annual “scheduled dress-rehearsal” for a coordinated volunteer efforts to use mobile devices and a Sea Level Rise app to map the extent of flooding caused by hurricanes, nor’easter storms, heavy rainfall and wind-amplified tides.
This year, 347 confirmed volunteers fanned out across the Hampton Roads region for data collection on Oct. 27, amassing nearly 33,900 time-stamped GPS points and 458 geotagged photos of high-water inundation.
PREVIOUSLY on Route Fifty:
Michael Grass is Executive Editor of Route Fifty and is based in Seattle.
NEXT STORY: Watch This State Office Building Twist and Sway


