NOAA launches coastal flooding dashboard

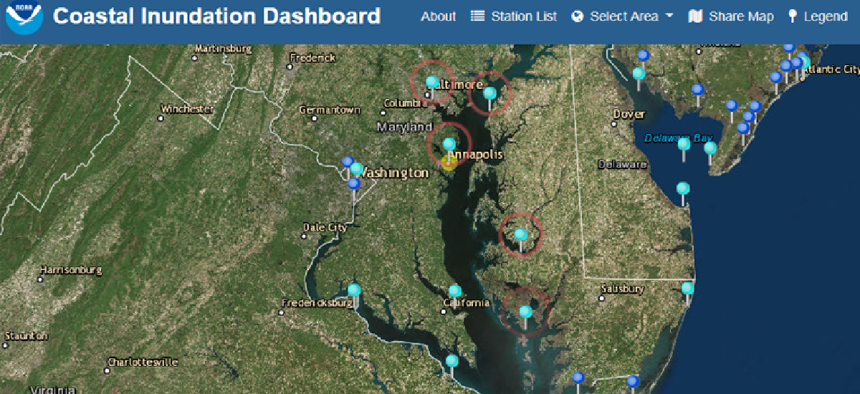
The Coastal Inundation Dashboard combines data from 200 coastal water-level stations into one web-based tool to help local decision-makers get real time information on an approaching storms as well as insights into longer-term risks like high-tide flooding and sea-level rise.
With the 2019 hurricane season just underway, the National Oceanic and Atmospheric Administration has merged data from its 200 coastal water level stations into one web-based tool to help local decision-makers get real-time information on an approaching storms as well as insights into longer-term risks like high-tide flooding and sea-level rise.
The Coastal Inundation Dashboard provides real-time and historic coastal flooding information at most of NOAA's coastal water level stations. If water rises above a certain level at a particular station, the dashboard will indicate minor, moderate, or major flooding, allowing local officials to make appropriate preparations.
The real-time and 48-hour forecasts are based on of the automated integration of data streams from observing systems, hydrodynamic model predictions measuring water levels, currents, salinity, temperature and waves. Users can also enable layers on the GIS-based dashboard to show more flood-related data such as water-level sensors operated by other federal or state agencies, satellite imagery showing cloud cover and wind watches or warnings provided by the NWS National Hurricane Center for active tropical cyclones.
The historical view shows station-specific information for the latest observed water levels and tide predictions overlaid upon known flood impact thresholds. Users can adjust the date in order to view past water level information and get access to sea-level trends, yearly inundation events, historic peak water levels and plot lines depicting one-year, two-year, 10-year and 100-year flood events, adjusted for sea level rise.
“The Coastal Inundation Dashboard … brings vast amounts of NOAA’s data together to benefit businesses and communities that drive our nation’s blue economy,” said Nicole LeBoeuf, acting director of NOAA’s National Ocean Service. “In one easy to use and comprehensive website, local emergency managers and coastal communities can more easily monitor water levels and make decisions before, during and after a storm to ensure they are more resilient to coastal flooding.”


