CARES dashboard ensures county spending delivers results

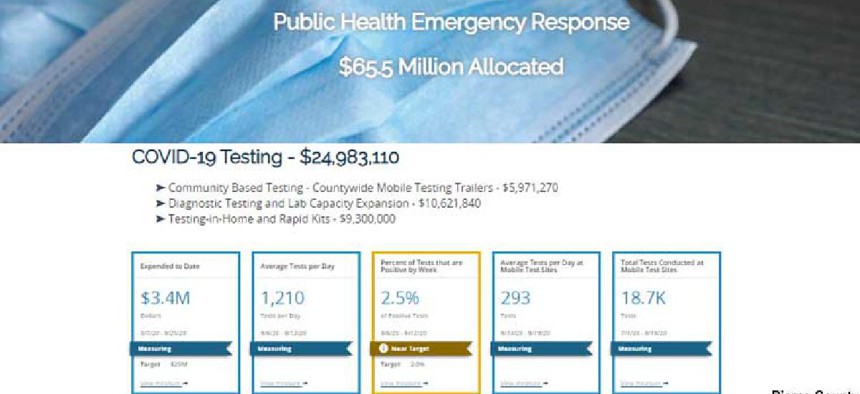
The CARES Act Funding Outcomes Dashboard helps Pierce County, Wash., monitor funding and key performance indicators for public health emergency response, economic stabilization and recovery, community response and resilience, and essential government services.
Pierce County, Wash., has enlisted a dashboard to help track how it allocates its portion of Coronavirus Aid, Relief and Economic Security (CARES) Act funding.
Powered by Tyler Technologies’ Socrata Government Connected Cloud and open data module, the CARES Act Funding Outcomes Dashboard monitors funding and key performance indicators for more than 90 activities in four categories: public health emergency response; economic stabilization and recovery; community response and resilience; and essential government services. The county received about $131 million of the CARES Act’s $2.2 trillion economic stimulus package.
“We’re able to draw in numerous datasets and have it all consolidated on a dashboard where we can see financial data along with our operational and programmatic data,” said Julie Demuth, Pierce County's finance and performance management administrator. “It allows us to make quick decisions on whether or not we need to reallocate funding to a different program. It helps us see which programs are the most effective and whether we need to add more funding to those programs, whether we need to make a process change or whether we need to make a policy change.”
For example, officials noticed in August that COVID-19 case numbers were spiking for the second time, particularly among 20- to 29-year-olds. They were able to allocate CARES Act funding to target that group through outreach.
The county has also used the data to “turn the dial” on its economic recovery program, Demuth said. It started by offering assistance to small and micro businesses and slowly expanded to help more firms.
“This helps monitor how many applicants we have, what types of businesses are using these programs, how quickly” the money is being allocated and whether the county need to help more businesses, Demuth said.
Additionally, county leaders get a weekly report based on dashboard data that they use to make adjustments. “We know that we’re making decisions based on data and fact,” she said. “It’s allowed our decisions to be really precise and effective. We’re not fumbling around … we’re able to pinpoint [issues] very quickly, make those changes very quickly, just pivot and make sure that things are working the way they’re intended to.”
The county has been using Socrata since 2018, which made using the technology in this way easy, she said. Because there was no learning curve, the dashboard took just weeks to build and turn around. The county pulls in numerous datasets -- financial data from its financial system and programmatic data from the Health, Emergency Management and Economic Development departments. For the human services community response effort, the county partnered with many outside providers, so the provider data is filtered by the Human Services Department before being added to the platform.
Some of the data is loaded automatically, but much is manual in that users go into the platform and upload a Microsoft Excel spreadsheet, Demuth said. “We can set up more automated processes, but with this particular effort – we got this dashboard launched in July – it’s just been a very rapid process, so we just haven’t put into place a lot of automation yet,” she said.
The public-facing web-based dashboard also meets the county’s transparency and accountability goals. It shows the amount spent to date in each category plus specifics such as the percent of positive coronavirus tests per week, the amount of personal protective equipment distributed and the number of veterans receiving emergency assistance. Each box has a “view measure” link that opens a chart showing how the numbers have changed over time and a link to source data.
Franklin Williams, president of Tyler Technologies’ data and insights division, said the main focus was getting the dashboard up and running quickly.
“It provides the ability to have an integrated stack that’s focused exclusively on the needs of the public sector,” Williams said. Besides pulling all the information into one platform, it gives users the tools they need ”to put that information in context, to be able to use it both internally and share it with the public in a way that is automated, up-to-date and authoritative,” he said.
The initial data was added during the building and implementation process, so now it’s just a matter of the data getting updated each week. And all of those visualizations update once the data is uploaded,” Williams said. “Once this dashboard is built out, it’s just a matter of maintaining the data updates.”
The county was looking to build this type of dashboard before the pandemic hit, Demuth said, so she expects to be able to repurpose it for the budget process when the crisis passes.
“As we allocate funds to new programs or new services, we want to be able to look” at the financial and operational data to be sure budget decisions “are producing the results that we intended and if not … pivot and either change how we’re funding, change our programs, make changes within our processes,” Demuth said.


