The States Where Driving Was Up and Down the Most After Covid Hit

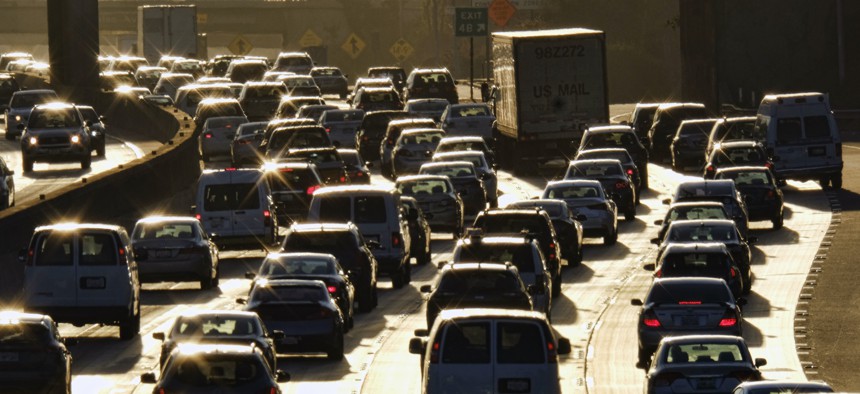
Morning rush hour traffic makes its way along US 101 near downtown Los Angeles. AP Photo/Richard Vogel, File
A new report shows wide variation between states when it comes to how often people got behind the wheel after March of last year.
There were sharp differences in how much drivers in each state hit the road last year in the months after the coronavirus pandemic struck, according to a recent analysis.
Bumper.com, a company that provides vehicle history reports, examined 2020 Apple Maps data to learn which states and cities saw the greatest increases and decreases in driving, public transportation use and walking. To assess the pandemic’s effect on drivers in the U.S., Bumper looked at average weekly levels of driving in states for most of last year and compared those metrics to the first three months of 2020, before the virus upended daily life.
As it turns out, drivers in states like Montana and South Dakota saw an increase of over 60% in driving, while the opposite was true in states like Florida and California, where driving decreased by 15%.
Looking at the U.S. overall, driving and walking had returned to roughly pre-pandemic levels by November, according to the report. In contrast, public transit ridership was still less than half of where it was before the pandemic began.
The differences in driving were widest between Wyoming and Hawaii. In Wyoming, there was a 78% increase in driving during the pandemic months. In Hawaii, a 47% decrease.
Evan Schlossman, a data analyst for Bumper, noted that states and cities where average driving activity decreased include many tourist destinations—like Hawaii, Florida and California. Honolulu; Naples, Florida; the San Francisco Bay Area and New Orleans were among the other places that saw the steepest decreases.
Meanwhile, five of the top 10 states that saw driving activity increase—Wyoming, North Dakota, South Dakota, Nebraska, and Iowa—were among the seven states that never issued stay-at-home orders. They’re also some of the more rural states in the U.S.
Here are the top 10 states that saw an increase in driving last year after the pandemic hit, according to the Bumper report:
- Wyoming (+78%)
- Montana (+66%)
- South Dakota (+64%)
- Idaho (+42%)
- Maine (+33%)
- Alaska (+30%)
- Iowa (+24%)
- Nebraska (+23%)
- North Dakota (+23%)
- Delaware (+22%)
And here are the states that had decreases:
- Hawaii (-47%)
- California (-15%)
- Florida (-15%)
- Arizona (-13%)
- New York (-3%)
- Texas (-3%)
- Nevada (-2%)
- Washington (-2%)
- Massachusetts (-1%)
Bumper points out that there are limitations with its research. For instance, it only looks at data for a single year and the pre-pandemic baseline is for the winter, which could affect how much people are traveling by different modes, particularly in colder climates.
A full copy of the report can be found here.
Brent Woodie is an associate editor at Route Fifty.
NEXT STORY: Police Departments Experiment With 70-Pound Robot Dog


