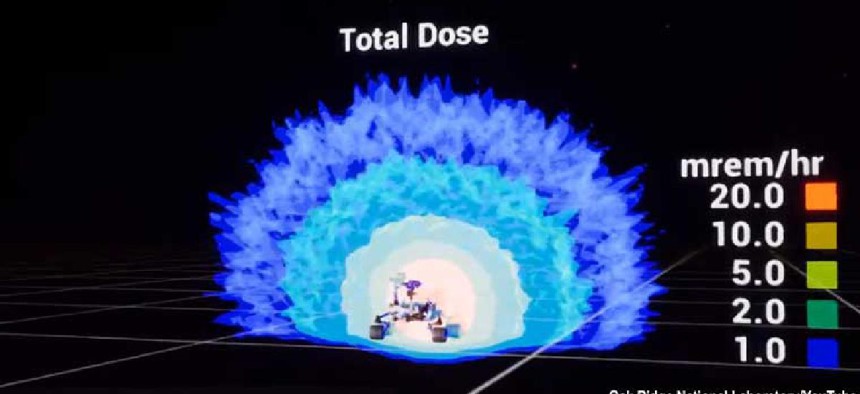
Video game engine powers radiation visualizations


Connecting state and local government leaders
The first-of-its-kind toolkit joins 3D radiation data with computer-aided design geometries to show how radiation impacts objects.
Researchers at Oak View National Laboratory are using video game development software to visualize data related to the movement of radiation.
Mike Smith, a nuclear space systems engineer, and Scott Greenwood, part of the reactor systems modeling and safety analysis staff, are using datasets originally produced for ORNL for analysis of NASA radioisotope power systems to create a first-of-its-kind toolkit that joins 3D radiation transport results with computer-aided design (CAD) geometries. These techniques can be used to inform the design phase of any nuclear project or to communicate radiation results, according to a lab announcement.
Trying to visualize and communicate radiation fields in technical ways where people can draw both qualitative and quantitative conclusions from calculations dates to the 1950s, Smith said. It’s difficult, however, because radiation data visualization is multidimensional and affected by interactions with physical materials.
Studying the radiation effects of a geometry -- something representing a space, such as a room or a spacecraft, where someone will conduct a radiological process -- requires running a particle transport model of that space to determine the radiation implications to that geometry. Those include how external environments, such as entry into another planet’s atmosphere, might affect it.
Smith and Greenwood take a known geometry, draw a new model in the radiation transport software and get a result that’s presented as a Monte Carlo simulation, showing possible outcomes. With the toolkit, now they can take the CAD geometry of a space, run the calculations and then superimpose those results back onto the original to show how the radiation data maps back to the real three-dimensional space, Smith said.
They use open source software from Epic Games’ Unreal Engine, which focuses on creating realistic environments. They generate the simulation data and put it in formats that can be exported to Unreal Engine, where they can display it however they feel works best for the situation.
A video demonstration of their work visualizes how the Mars Curiosity Rover on Mars is subjected to neutron and gamma emissions. The radiation field spreads out around the rover in graduated shades of aqua to indicate the total amounts, and then the image spins to represent the radiation in all directions.
Existing tools for radiation visualization are not easily understood by the non-nuclear community, even though other audiences may need to access the data.
“When we’re trying to communicate an invisible radiation field and its impact and influence on some piece of technology, the ‘a picture’s worth 1,000 words’ saying goes a long way,” Smith said. “When you can show a group of highly intelligent technical people that do not have a nuclear background an effective representation of what is happening and what this feels like with relationship to their technology, I believe it can help in the long run streamline technical communication and education of the general public.”
What’s more, their work can be replicated for use beyond the nuclear community. Whenever someone has a number representing a magnitude or an intensity of some value that corresponds to a spatial coordinate – like thermal information -- it can be mapped, he said.
The researchers have been working on the toolkit for about 18 months. They recently won an internal research project that will allow them to use the infrastructure they’ve developed for visualizing in general and mapping data to augmented realities.
“If we could streamline a process, package a method, if you will, where other people could use these same techniques, I would say that’s kind of a broad goal,” Smith said. “We would like this to be the new norm moving into the future. I feel like for the 21st century, as far as data visualization techniques go, the nuclear engineering industry and particle transport field within that industry are a little bit behind right now and could really benefit from these visualization techniques.”


