The new Normals: NOAA releases 30-year climate data

The 2021 Climate Normals show the 30-year weather and climate averages based on observations from federal weather stations and thousands of citizen scientists.
This week, the National Oceanic and Atmospheric Administration released the 2021 Climate Normals, data on the 30-year average of weather and climate made from statistical calculations based on observations from approximately 15,000 federal weather stations and thousands of citizen scientists across the country.
Every 10 years, NOAA’s National Centers for Environmental Information generates the official U.S. Normals, which rely on daily and hourly recordings of temperature and precipitation as well as 500 other types of weather and climate statistics such as snowfall, frost and freeze dates.
The Normals are used by the National Weather Service (NWS) and the Department of Agriculture, as well as private-sector meteorologists and forecasters, to supply data for aviation, energy, construction, infrastructure and agricultural companies.
More than 900 Automated System Observing Stations (ASOS) provide observations every minute of every day, from sensors that measure wind speed and direction, dew point, air temperature, precipitation type and amount, visibility, cloud height and thickness and station pressure, according to NOAA.
Additional data comes from more than 10,000 volunteers with the Cooperative Observer Program who file daily reports from cities, farms, national parks, seashores and mountaintops. They gather data on daily maximum and minimum temperatures, snowfall and 24-hour precipitation totals. In some cases additional hydrological or meteorological data such as evaporation or soil temperatures is included.
Accuracy of data from ASOS and the Cooperative Observer Program is quality-controlled first by NWS meteorologists and then by a comprehensive sequence of automated computer procedures at NOAA’s National Centers for Environmental Information (NCEI), NOAA officials said. In some cases, additional manual quality assessments are also conducted.
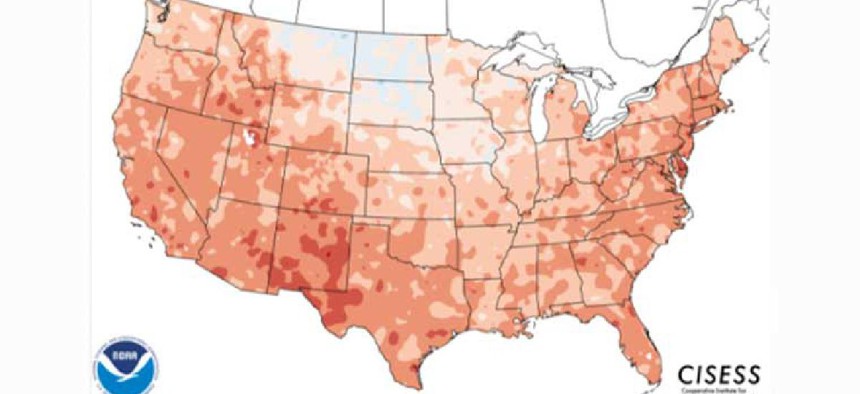
Although U.S. Normals are most useful for understanding present-day conditions, the new data shows an upward shift in temperature averages, making 1991-2020 the warmest on record for the country. The data also shows more precipitation than 20th century averages with dry spots in the southwest.
In the coming months, NOAA said it will release detailed monthly Normals data for the contiguous U.S., as well as develop new tools and methods to access the data.
Additional products and services will be released later in 2021 and into 2022, including Daily Gridded Temperature and Precipitation Normals. Plans are also underway for NOAA NCEI to become a repository for climate Normals from countries around the world.


