Census rebuilds construction data collection, analysis processes

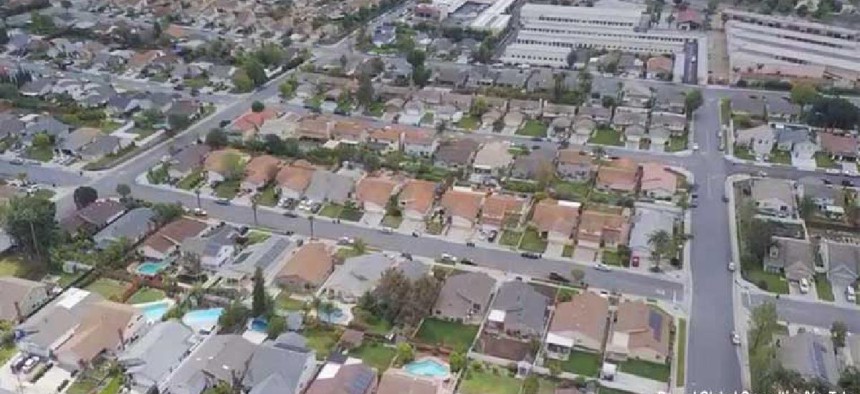
By automating the classification of construction activities shown in satellite images, the Census Bureau has eliminated the need to manually collect and process data from thousands of survey responses.
For the last 50 years, the Census Bureau’s Economic Indicators Division has relied on manual data collection and now-legacy processes for analyzing and reporting economic insights into the nation’s construction activity. The volume of data collected and the short turnaround times has challenged Census to collect, process, analyze and deliver monthly reports on new housing starts from 20,000 jurisdictions.
Re-Engineering of the US Construction Indicator Using Satellite Image Analyses
U.S. Census Bureau
Click here for all the 2021 Public Sector Innovation winners
To take advantage of new sources of third-party data and provide more granular information for the monthly U.S. Construction Indicator reports, Census worked with Reveal Global Consulting to design and automate approaches for data collection, analysis and dissemination that reduced costs while improving the accuracy and quality of Census economic indicators.
The program consists of an end-to-end solution that collects, filters, formats and aggregates unstructured data from Census and numerous third-party sources. The data is ingested into the Alteryx unified analytic process automation platform for examination.
By applying machine learning to satellite imagery, for example, the solution has learned to automatically identify and classify new construction sites and changes to existing ones across an area equivalent to 11 million football fields. It also ingests on permit data for residential single-family homes, web-scraped websites from local jurisdictions and census shapefiles.
Algorithms filter, format and aggregate data, conduct spatial analysis and evaluate coverage and accuracy of third-party data -- including images. The solution then merges all the data and images, creates visualizations and updates the Construction Indicator.
The solution has been able to improve the depth and breadth of data collection and automate all the repetitive, error-prone tasks that had been involved in producing the Construction Indicator -- while remaining cost neutral. It also frees up Census analysts to perform higher-value tasks and can be expanded to improve other Census products.
The timely, relevant insights provided by advanced analytics and data visualization gives Census data users and external stakeholders the tools they need for optimal decision-making.
NEXT STORY: States With the Most and Least Cybercrime


