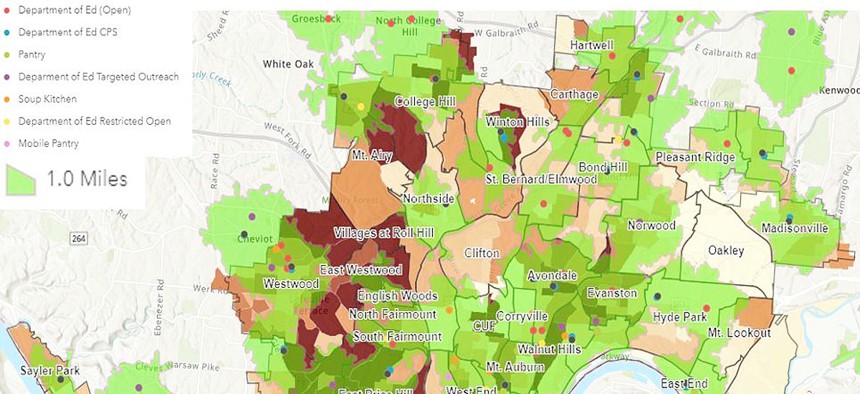
Cincinnati maps food insecurity gaps

84.51
Building off of its emergency food delivery response at the height of the pandemic, the city is now using the same tools to tackle the long-term issue of food insecurity.
Initially motivated by a steady rise in the region’s “food deserts” Cincinnati turned to data-mapping tools to help feed the more than 76,000 food-insecure children living in the 20 counties in the Cincinnati tristate area.
During the pandemic, Councilman Greg Landsman, along with the Cincinnati Children’s Hospital and the local school district, partnered with the data science company 84.51°, which has helped Kroger on many food-related data initiatives in the Cincinnati area. The company helped the city identify and distribute emergency provisions at locations convenient to food-insecure families with children through the local Freestore Foodbank and its “Growing Beyond Hunger” initiative.
“At the height of the emergency, the first thing [84.51°] did was get data from all of our partners, and all of the locations we were currently providing food,” Landsman said. “They [combined] that data with where our families and children [in need] were and found that there were pockets where we needed to fill the gap.”
After the initial COVID-19 outbreak, Cincinnati Public Schools became main food distribution sites, but the city wanted to be sure they would be easy for food-insecure families to access.
“We used Esri’s software to show, just at a block level, what the number of impoverished children looked like,” 84.51° Data Scientist Charles Hoffman said. “And then started looking at those 24 Cincinnati Public School sites, then overlaid the two.”
Hoffman said 84.51°’s goal was to ensure that no child in an area of high food insecurity would have to walk more than a mile to get to a food distribution site – a metric used by the Atlanta Community Food Bank, he noted. With a mix of predictive analytics and data science, the firm was even able to provide a ranked distribution list highlighting sites that prioritized translators for Spanish-speaking populations.
Landsman pointed to other areas where this analytic approach could benefit Cincinnati, citing the Cincinnati Office of Performance and Data Analytics’ successes with using citywide data to monitor performance, improve service delivery and solve problems.
“The data that we used in the food distribution work was action-oriented, where a group of people used information in real time to deliver services,” he said. “And that can be applied to public safety, allowing police to target crime block by block. With housing, it would show us where we could provide rent support.”
In addition, Landsman cited the looming childcare crisis, noting that this method of identifying the existing providers and families in need of childcare could find the gaps where the city can intervene.
Hoffman said the goal of the food distribution program is to reduce the gap between the number of meals a neighborhood needs and the number it receives. Currently, the plan is to test service delivery in three neighborhoods – Avondale, Lower Price Hill, and East Price Hill – and eventually scale the program to the whole city.
“Even if some of these interventions do not work, we have created an infrastructure to … measure the effectiveness and move on to testing other ideas, so I think the process is important in this space,” he said.


