Sensor, satellite data help map, predict heat islands

NC State Climate Office
A community project to map urban heat in North Carolina sent volunteers out to collect sensor data, which was then used – in combination with satellite imagery and machine learning -- to create predictive surface temperature maps.
With the help of scientists and community volunteers, a temperature mapping campaign in North Carolina is using sensor data to better understand where urban heat islands occur in Raleigh and Durham and data analytics tools to inform mitigation efforts.
In July, volunteers in both cities gathered real-time data by going out to collect various metrics, including ambient temperature and humidity data, over three different time periods – 6 to 7 a.m., 3 to 4 p.m. and 7 to 8 p.m.
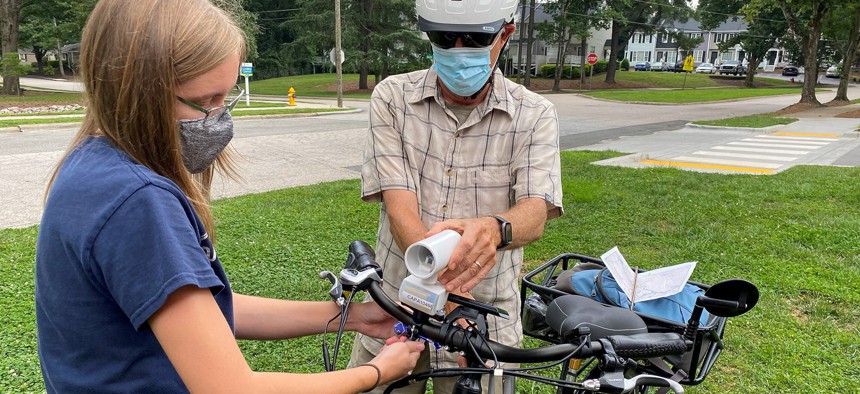
Volunteers with heat sensors mounted on their cars, bicycles or in their pockets were given a route and turn-by-turn instructions for collecting data over the course of each hour, North Carolina State Climate Office Technician Myleigh Neill told GCN.
Nearly 100,000 data points were collected during the Urban Heat Island Temperature Mapping Campaign, researchers said during a Feb. 3 webinar. The modeling process, conducted by data analytics company CAPA strategies, rendered six maps displaying point temperatures and area-wide heat maps during each of the three periods.
The project, designed to generate high-resolution temperature and heat index maps of the two cities, revealed that parts of Raleigh and Durham were warmer than researchers initially thought.
To reach that conclusion, CAPA first downloaded the raw heat data from the SD cards in the volunteers’ sensors. After comparing the information with field notes, the data was classified by the time window, and the volunteer's speed and study area.
Then, multiband land-cover raster images were downloaded from the Sentinel-2 satellite for more detailed analysis. Finally, the heat sensor and land-cover data were combined using a machine learning model; this created predictive raster surface models for each of the three time periods.
Using a machine learning process, the researchers were able to model data for areas the volunteers did not survey, CAPA Strategies Advisor and Portland State University Professor Vivek Shandas said.
For example, for each temperature recorded in a park, the modeling process can reveal how closely that heat reading meets the set expectations as well as how much of the temperature can be attributed to surrounding areas.
“[The maps] become a surface that uses computer modeling, and allows us to develop a continuous description of temperature on a typical warm, late July day in Raleigh and Durham. That is the core of what this project was about,” Shandas said.
This project was a part of the 2021 National Integrated Heat Health Information System and Climate Adaptation Planning Analytics HeatWatch Campaign. Raleigh and Durham were among 13 locations around the country selected to participate.
NEXT STORY: Connected vehicle data often goes unused


