Open bus data makes transit schedules more reliable

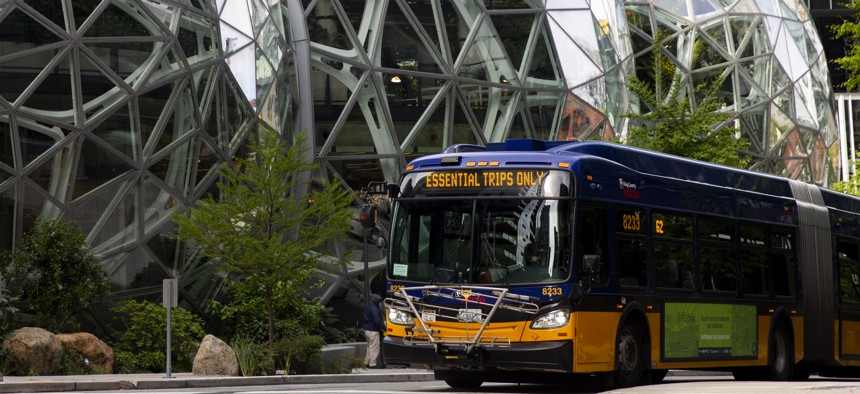
A King County Metro bus for essential trips only passes by The Spheres at the Amazon campus on April 30, 2020 in Seattle. GettyImages/ Lindsey Wasson / Stringer
Researchers at the University of Washington used bus location and speed data from two Seattle-area transit networks to create a dashboard that shows the average bus speed between stops, allowing officials to pinpoint slowdowns.
To identify the areas where buses slow down and pinpoint where improvements can be made, researchers are tapping into open bus data.
As part of an ongoing study, researchers at the University of Washington Mobility Innovation Center built an open source tool called TransitVis to help transit officials find chronic slow spots and optimize bus travel time.
Using location data from King County Metro and Sound Transit buses in the greater Seattle metropolitan area, TransitVis illustrates bus network performance on individual street segments. Average transit speeds are calculated in an AWS cloud each day from data captured at 30-second intervals for each active trip.
This information is overlaid on a city map, and with the help of a spatial index, the tool quickly matches and assigns the bus performance to the roadway segment it is traveling. Bus speed is coded by color, showing which routes experience slowdowns. Users can also filter and view the data by median speed, pace, number of traversals and various other metrics.
Transit agencies already collect and openly share route data with developers through the General Transit Feed Specification, but GTFS scheduling data may not accurately reflect actual service.
However, an extension of the format, called GTFS-RT, collects “real-time data from automatic vehicle locators on buses to capture travel speeds and locations with more precision,” a Mobility Innovation Center press release said. With the updated format, transit agencies can better spot problem areas and make improvements along routes. The enhanced insights will also make it easier for planners to make broader adjustments – like padding schedules with extra time between stops or reducing speeds to maintain a reliable schedule for riders.
Initially launched in 2020, the project was designed to show city transportation officials where ride-hailing services affected bus schedules, helping them improve management of curbsides, parking changes and loading zones. Early assessments, however, showed the bus routes in question were not affected by curbside pick-ups and drop-offs – but researchers were able to use the real-time data to develop TransitVis.
Mobility Innovation Center officials said the TransitVis research can be used to generate reusable analytical tools for other local agencies and that the tools will eventually be adapted to work with a wider set of GTFS-RT feeds. Improvements in computational efficiency will allow for greater volumes of data to be analyzed by a range of users, and transit agencies will be able to use machine learning to determine causes of delay based on signatures in the GTFS-RT data.
Users will essentially be able to treat the tools as a “plug and play” environment, the university said, enabling other insights related to number of passengers on board, bus speed anomalies and curbside stops.


