How Has Federal Spending on State and Local Grants Changed Over the Last 57 Years?

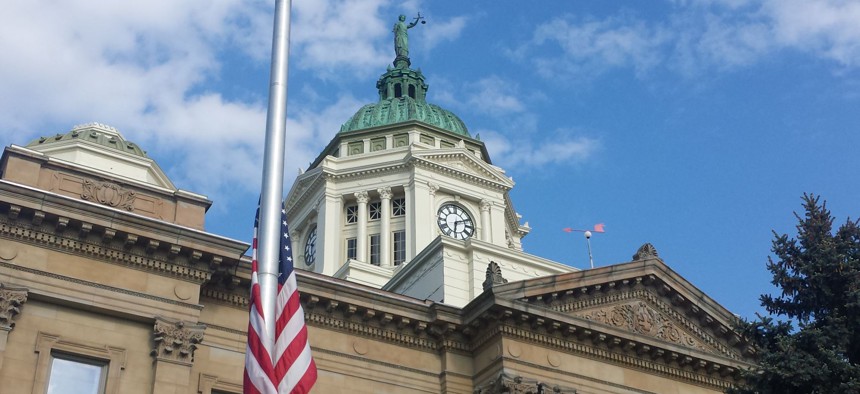
The Wyandot County Courthouse in Upper Sandusky, Ohio Michael Grass / Route Fifty

Connecting state and local government leaders
Four charts that illustrate the evolution in spending.
Tucked within the materials the White House released last week with President Trump’s fiscal year 2018 budget proposal are figures showing how federal grants to state and local governments have changed over the last half-century.
The numbers illustrate how grants going to health programs, specifically Medicaid, have skyrocketed since 1960.
Inflation-adjusted spending on grants for other areas, like transportation and community development, have grown much slower during that time, or fluctuated up and down.
Of the roughly $660 billion in grants to state and local governments that flowed out of Washington during fiscal year 2016, about 60 percent went toward health-related spending.
Total outlays during the 2016 budget cycle for state and local health grants were around $396 billion.
About $368 billion of that sum, roughly 92 percent, went toward grants to states for Medicaid—a program that provides access to health care for low-income Americans.
Each of the following charts is meant to offer some perspective on how federal grants to states and localities have evolved in recent decades.
1.) Total Outlays for State and Local Grants, Adjusted For Inflation, 1960-2016
This first chart shows total federal outlays—meaning the amount of money the federal government paid—for grants to state and local governments during select years between 1960 and 2016.
Figures for 2017 are estimates from Trump’s budget proposal. All values are adjusted for inflation and presented as 2017 dollars.
Click on the chart to expand it in a new window.

Some significant factors that have affected grant spending over the years include: legislation then-President Lyndon Johnson signed in 1965 that led to Medicaid; the Great Recession, which began in late 2007 and prompted federal stimulus spending; and the expansion of Medicaid coverage that first became effective in some states in 2014 under the Affordable Care Act—the health care law that is also referred to as Obamacare.
The “income security” category in the chart includes spending on programs to assist the poor, such as rental assistance, the Supplemental Nutrition Assistance Program, commonly called food stamps, and child nutrition programs, like those that provide lunches to school children.
2.) Total Outlays for State and Local Grants (Other Than Health Spending), 1960-2016
This next chart is the same as the one above but without health grants.
It’s meant to give a clearer look at how grants not tied to health spending have changed.
Click on the chart to expand it in a new window.

3.) Select Grant Categories as a Percentage of State and Local Grant Spending
This chart shows spending on the five largest categories of federal grants going to state and local governments as percentages of total federal spending on state and local grants.
Click on the chart to expand it in a new window.

4.) State and Local Grants as a Percentage of Federal Outlays
This final chart shows state and local grants as a proportion of overall federal outlays.
Figures for 2017 and 2018 are estimates included in Trump’s budget plan.
Click on the chart to expand it in a new window.

Trump has proposed sweeping cuts in his spending plan to programs that many local governments rely on for funding. His budget proposal also factors in significant reductions in the coming years in the amount of money going to states for Medicaid.
It will be up to congressional lawmakers in the weeks and months ahead to decide to what extent they will go along with the president's proposals.
PREVIOUSLY on Route Fifty:
- “Trump’s Not Backing Down on Cuts to Local Government Programs”
- “Trump’s Budget Calls for $610 Billion in Cuts to Medicaid—What Does that Mean for States?”
This post has been updated to include an additional chart.
Bill Lucia is a Senior Reporter for Government Executive's Route Fifty and is based in Washington, D.C.

NEXT STORY: Senator Rejects White House Rationale For Gutting Great Lakes Restoration Funds


