A Look at How 150 Governments are Planning to Use ARPA Funds

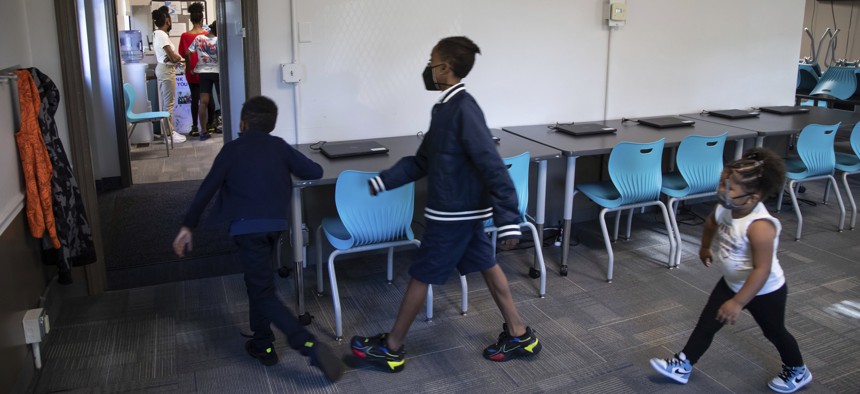
In this Oct. 1, 2021 photo, children walk through new Rec2Tech space at Jefferson Recreation Center, which will provide access to technology and innovative programming for community members including STEM, computer science and coding education, combined with the arts in Pittsburgh. The city plans to use some of the money from the American Rescue Plan, passed by Congress last spring, to continue expanding these programs. Initial programming will be for young people, with plans to grow the programming into the broader community. AP Photo/Rebecca Droke
A new online dashboard offers insights into what cities and counties intend to do with the federal pandemic aid.
For those interested in how local governments across the U.S. intend to use billions in pandemic aid provided under the American Rescue Plan Act, a new online tool released Thursday is worth taking a look at.
Good government nonprofit Results for America and policy research firm Mathematica created what they're calling the American Rescue Plan Data and Evidence Dashboard. It presents information gleaned from reports 150 cities, counties and tribes have filed with the federal government outlining their spending plans for ARPA allotments.
“The thing we’ve heard from our communities, our cities and counties, has been: What are others doing? There’s a huge network of people who are committed to using this money effectively to both build out their own capacity and deliver real results for residents," said Zachary Markovits, vice president of local government at Results for America and managing director for the What Works Cities initiative.
The dashboard allows users to look at spending by category—for instance, public health, offsetting lost revenues or infrastructure.
It also sheds light on how many communities are putting funds and effort towards five areas that are tied to program design and implementation. These include community engagement, focusing on equitable outcomes, pursuing policies that are backed by evidence showing they're effective, building and strengthening policymaking data and evidence, and investing in program evaluation.
Candace Miller, a researcher at Mathematica who worked on the project, said there were some "star performers" in these areas, but added that "there’s a lot of growth potential in using evidence-based programming, in building data capacity."
Additionally, dashboard users can select sets of jurisdictions and compare how they are using their funds in different ways. The website for the tool also allows for easy access to the reports it is based on—a useful feature given that the reports are not all housed in one place.
Range of Spending Plans
Data presented in the dashboard indicates that at least 92 of the 150 jurisdictions are using, or have "shown promise" that they will use, ARPA dollars to replace revenue losses brought on by the pandemic. That category is especially notable because it provides some of the greatest flexibility in how states and localities can spend the funds.
At least 108 communities are using, or showing signs they will use, some of the money for public health spending and 112 on programs meant to alleviate economic damage Covid-19 caused for residents or businesses. These are just a handful of the spending categories that the dashboard tracks.
Markovits said the data show that cities and counties are doing more than just plugging budget holes with the money. “What we found was an exciting level of investment in the future," he said.
The dashboard shows 57 jurisdictions are looking at different types of pilot programs, while 19 are planning to invest in, or showing signs of putting money into, guaranteed basic income programs and 51 have indicated that they'll spend on education and youth development.
On the implementation and evaluation front, 83 localities are showing clear or promising signs of spending on programs that are evidence-based (meaning they're backed up by analyses showing that they work). Forty-seven are indicating that they'll use the money in ways that will help build data and evidence related to their programs and 67 plan to invest in program evaluation.
“This dashboard helps people not only understand that they can use the ARP dollars to build data and evidence and use it for equitable outcomes and community engagement, but see what their colleagues are doing to do that work well," said Nichole Dunn, vice president of federal policy at Results for America.
A program in Madison, Wisconsin offers one example of funding plans for a new initiative that will be evaluated to determine how well it works. The city was looking at evaluating a program that is meant to improve the way it responds to emergency calls involving people who are having mental or behavioral health difficulties.
Going forward the groups that built the dashboard plan to update it with data on states, and with additional information about the local government spending plans as it becomes available.
The dashboard can be found here.
Bill Lucia is a senior editor for Route Fifty and is based in Olympia, Washington.
NEXT STORY: Poll: Nearly Half of US Households Facing Inflation Hardship


