State Medicaid costs poised to surge from pandemic lows

Melissa Phillip/Houston Chronicle via Getty Images


State costs rose by 13% in fiscal 2023 and are expected to increase by an additional 17.2% in fiscal 2024 thanks to the phaseout of enhanced federal aid, provider rate increases and slowing but still elevated enrollment levels.
In fiscal year 2021—the first full budget year marred by the COVID-19 pandemic—states collectively spent 14.1 cents of every state-generated dollar to provide Medicaid coverage to low-income Americans; that was 1.5 cents lower than the 15-year average of 15.7 cents of every state dollar. A pandemic-related surge in tax revenue, coupled with temporary additional federal funding, contributed to the decrease in the share of state funds that were dedicated to Medicaid. But as federal pandemic aid concludes and Medicaid enrollment remains near historic highs, The Pew Charitable Trusts and other experts expect that share to rise by the end of the current budget year.
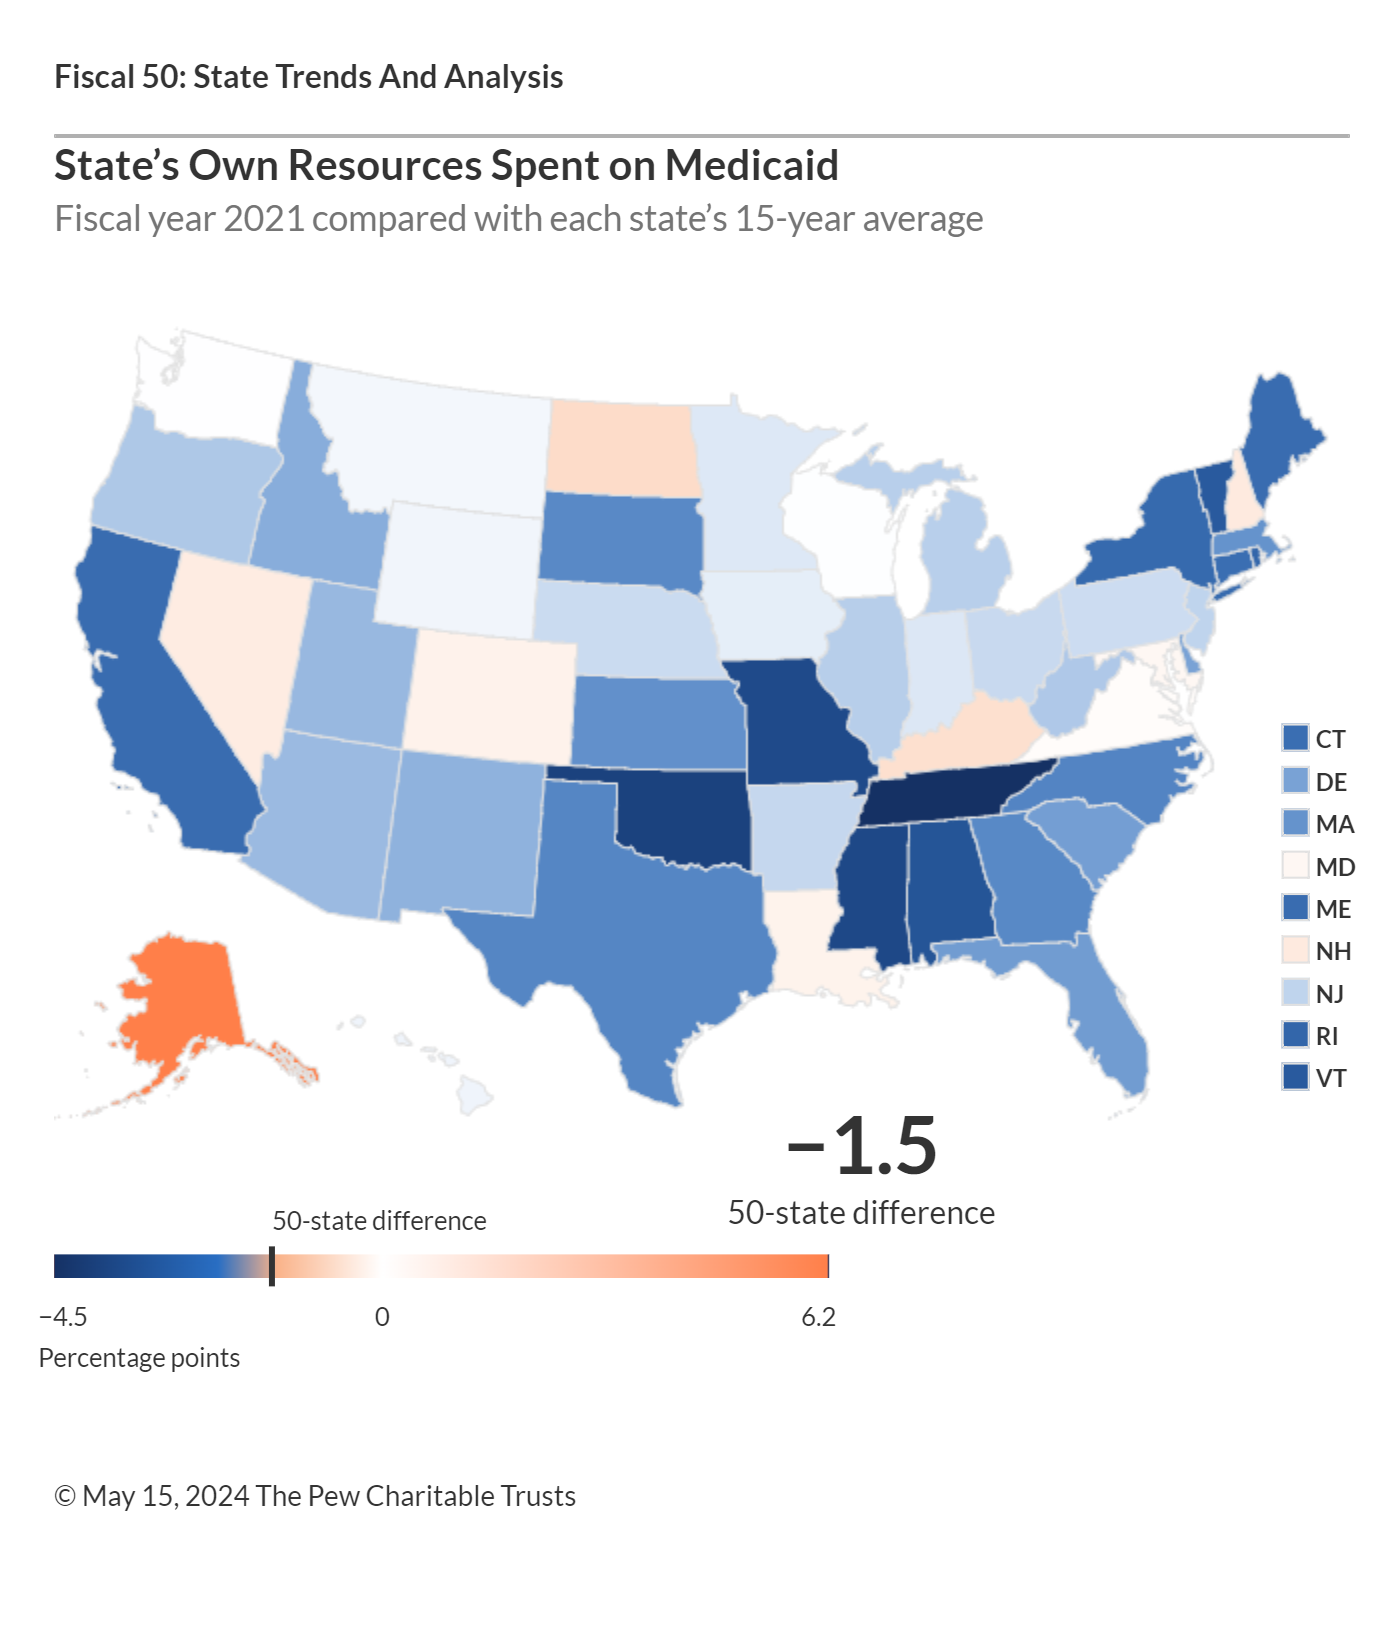
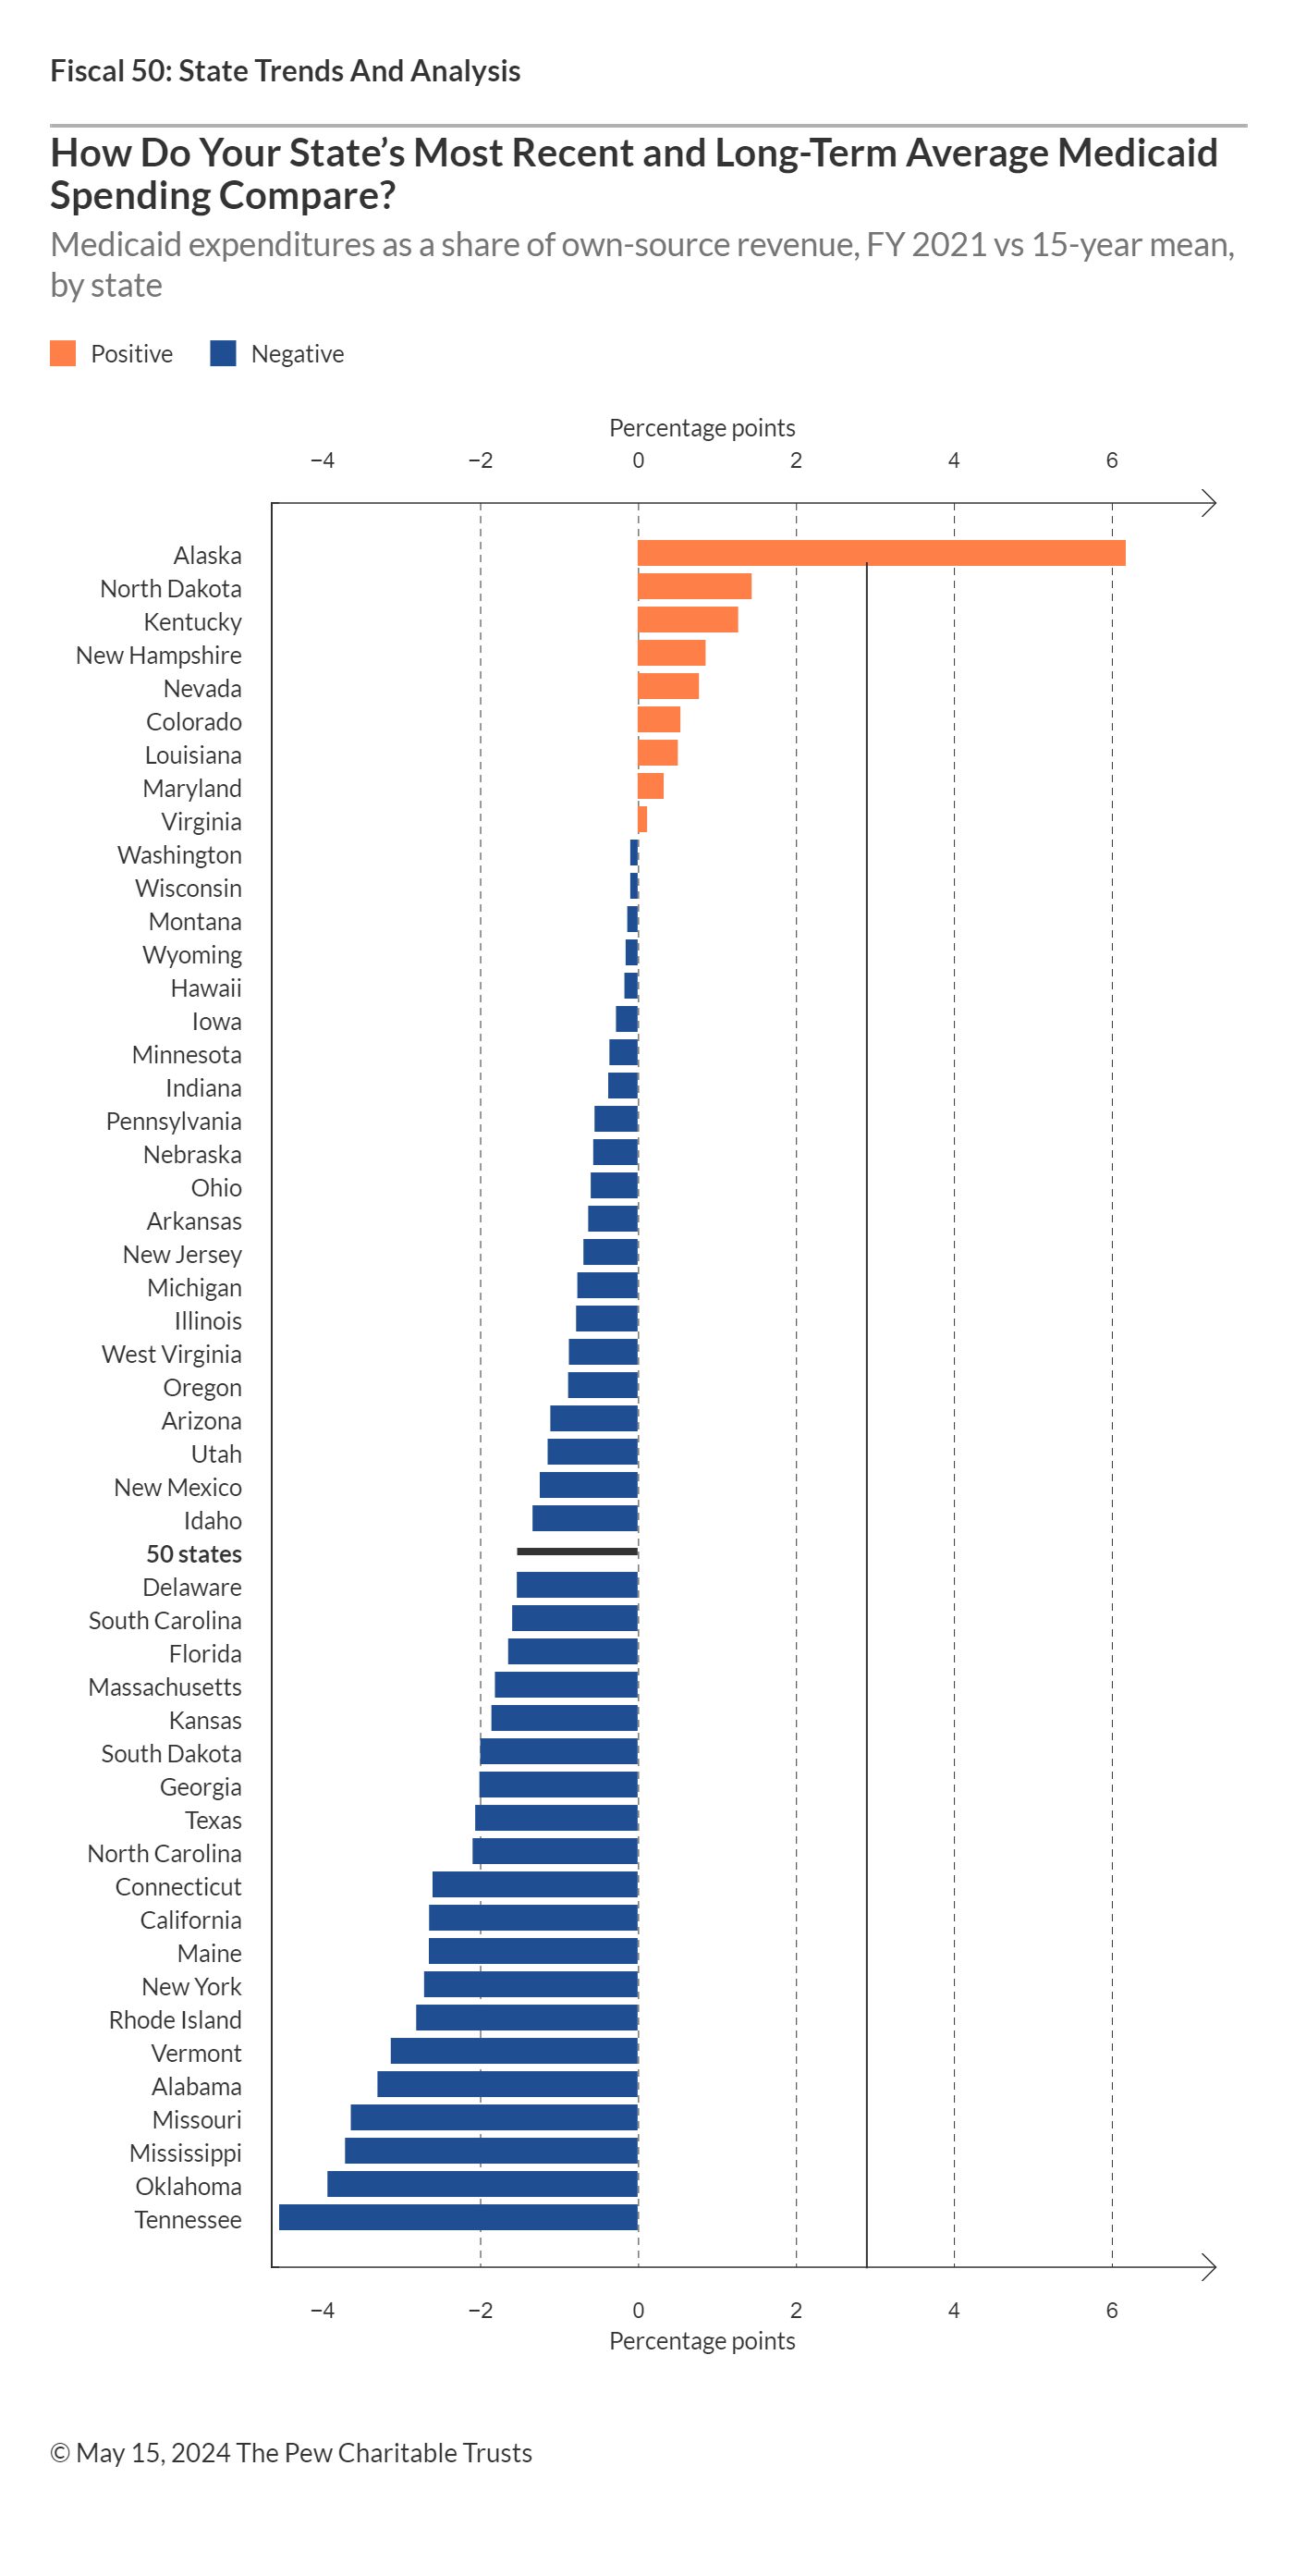
All but nine states spent a smaller share of their own dollars on Medicaid in fiscal 2021 than they had, on average, over the previous 15 years. Differences ranged from 4.5 percentage points in Tennessee to less than a tenth of a percentage point in Washington and Wisconsin.
Sources: Pew analysis of data from the Centers for Medicare & Medicaid Services, the National Association of State Budget Officers, and the U.S. Census Bureau.
States and the federal government share costs for Medicaid, which provides medical coverage for eligible groups of children, adults, people with disabilities, and the elderly. Medicaid is most states’ biggest expense after K-12 education.
Pew’s state Medicaid spending indicator excludes federal support, examining only the cost to states because that spending exerts pressure on their operating budgets, which rely on state-generated revenue.
Medicaid’s claim on each revenue dollar affects the share of state resources available for other priorities, such as education, transportation, and public safety. Federal law requires states to provide certain benefits for any eligible Medicaid enrollee, even during times of sluggish revenue growth. So policymakers have less control over growth in states’ Medicaid costs than they do with many other programs.
Most states posted a decrease in the share of state funds dedicated to Medicaid in fiscal 2021 compared with the previous year. Nationally, this share dropped by 1.7 percentage points—the most substantial annual drop since at least fiscal 2000. The extent of the declines ranged from 4.3 cents per state-generated dollar in California to a tenth of a percentage point in Arizona. A confluence of factors drove these significant declines, including a simultaneous increase in temporary federal Medicaid aid and higher-than-anticipated growth in tax revenue following the onset of the pandemic.
State Medicaid costs are expected to rise dramatically by the end of the current budget year. Survey data from the Kaiser Family Foundation shows that state costs rose by 13% in fiscal 2023 and are expected to increase by an additional 17.2% in fiscal 2024. In their survey responses, states identified the phaseout of enhanced federal Medicaid aid, provider rate increases, and slowing but still elevated enrollment levels as key drivers of these increased annual costs, which, coupled with weakening tax revenue collections, are likely to push up the share of state funds spent on Medicaid going forward.
Sources: Pew analysis of data from the Centers for Medicare & Medicaid Services, the National Association of State Budget Officers, and the U.S. Census Bureau.
State Highlights
A comparison of the share of each state’s own-source revenue spent on Medicaid in fiscal 2021 with its average share over the previous 15 years shows that:
- Alaska’s share rose the most. In fiscal 2021, the state spent 15.6% of its own revenue on Medicaid, 6.2 percentage points higher than its 15-year average—equivalent to 6.2 cents more of each state-generated dollar. It was the only state where Medicaid reached its highest percentage of own-source spending since 2007.
- Besides Alaska, only North Dakota (1.4) and Kentucky (1.3) surpassed their 15-year average shares by more than 1 cent per state-generated dollar.
- Only two states spent more than one-fifth of their own revenue on Medicaid in fiscal 2021: Pennsylvania (20.2) and New York (23.6), which contributed the largest share of any state.
- The states that spent the smallest share of their own dollars on Medicaid in fiscal 2021 were Utah (4.4), Alabama (6.6), Oklahoma (7.2), Mississippi (7.7), and Hawaii and Idaho (both 8).
Trend Drivers
In fiscal 2021, states collectively allocated $240.5 billion from their own resources to support health benefits for 86.3 million Medicaid recipients. This marked a 2.8% increase, or $6.6 billion in new spending, from fiscal 2020. But states’ own-source revenue grew even faster, leading to a drop in the portion of state funds dedicated to Medicaid coverage.
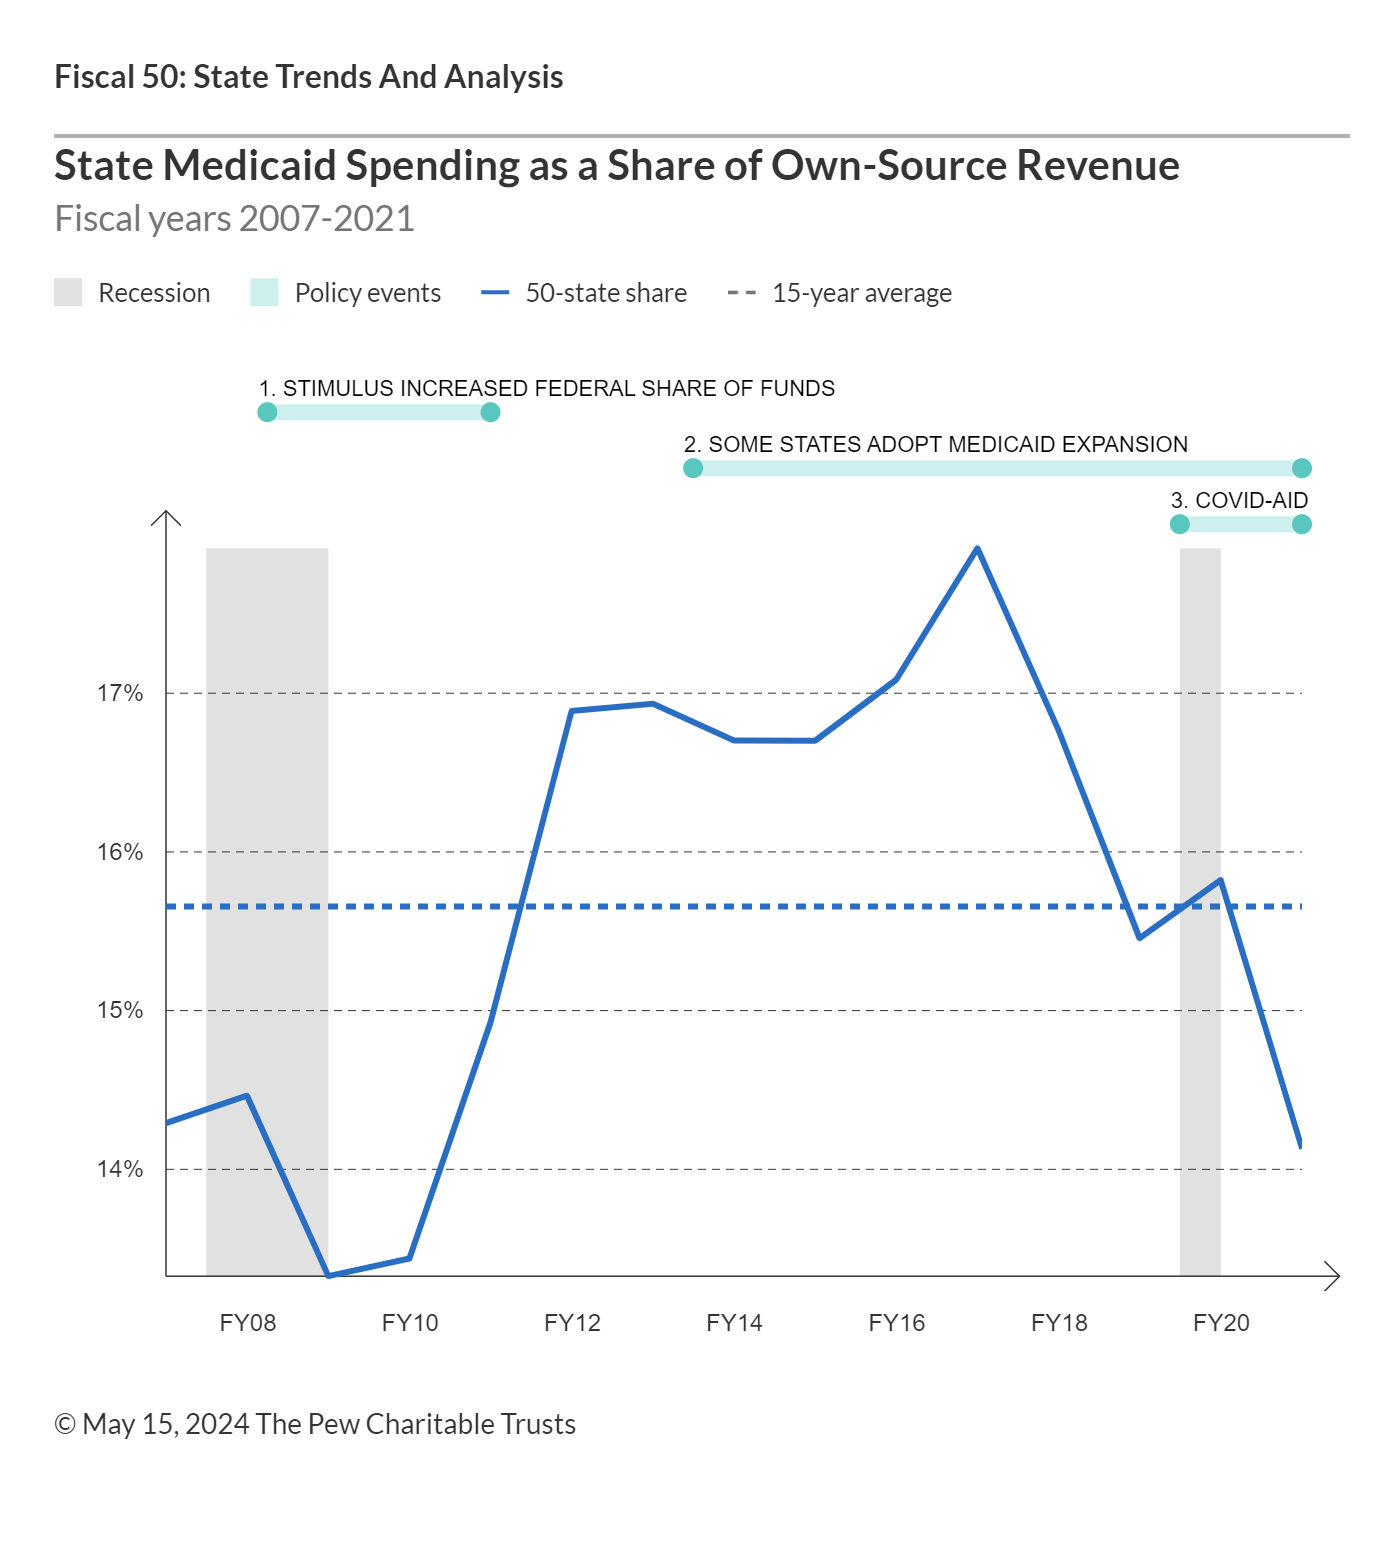
Note: In 2006, the federal government began covering prescription drug costs for individuals who qualify for both Medicaid and Medicare. In response to the 2007-09 recession, the federal government sent extra dollars to states to help cover increased costs associated with higher Medicaid enrollment. In 2014, the Affordable Care Act allowed states to expand coverage of their Medicaid programs with increased federal support.
Sources: Pew analysis of data from the Centers for Medicare & Medicaid Services, the National Association of State Budget Officers, and the U.S. Census Bureau.
Higher enrollment is one of the major long-term drivers of growth in Medicaid spending; more than twice as many people were on Medicaid rolls in fiscal 2021 than in fiscal 2000. Until the onset of the COVID-19 pandemic, however, enrollment growth had been slowing. From 2000 to 2013, several factors fueled rising enrollment, including two economic downturns—which caused people to lose jobs and associated health insurance—and a gradual erosion of employer-sponsored insurance in general. From 2014 until the present day, millions more Americans joined Medicaid as most states implemented the optional expansion under the 2010 Affordable Care Act (ACA). But because the federal government absorbed the first three years of related expenses for those newly eligible enrollees, states only began picking up a portion of these costs in 2017.
Although the pandemic triggered a historic but temporary surge in Medicaid enrollment, states expect a decline in fiscal 2024 and 2025. This is largely because of the expiration of one-time federal pandemic aid and a related rule that prevented states from unenrolling individuals for the duration of the public health emergency from Jan. 31, 2020, to May 11, 2023. Strong economic conditions, including low unemployment, are also contributing to the downward trend in Medicaid enrollment, as more workers gain access to employer-provided health care.
Conversely, several factors are simultaneously exerting upward pressure on state Medicaid spending, including rising prescription drug prices and widespread increases in health care provider payment rates. Additionally, state policy choices, such as expanding coverage, or the potential impact of an economic slowdown could contribute to growth in Medicaid spending.
Medicaid Spending by Level of Government
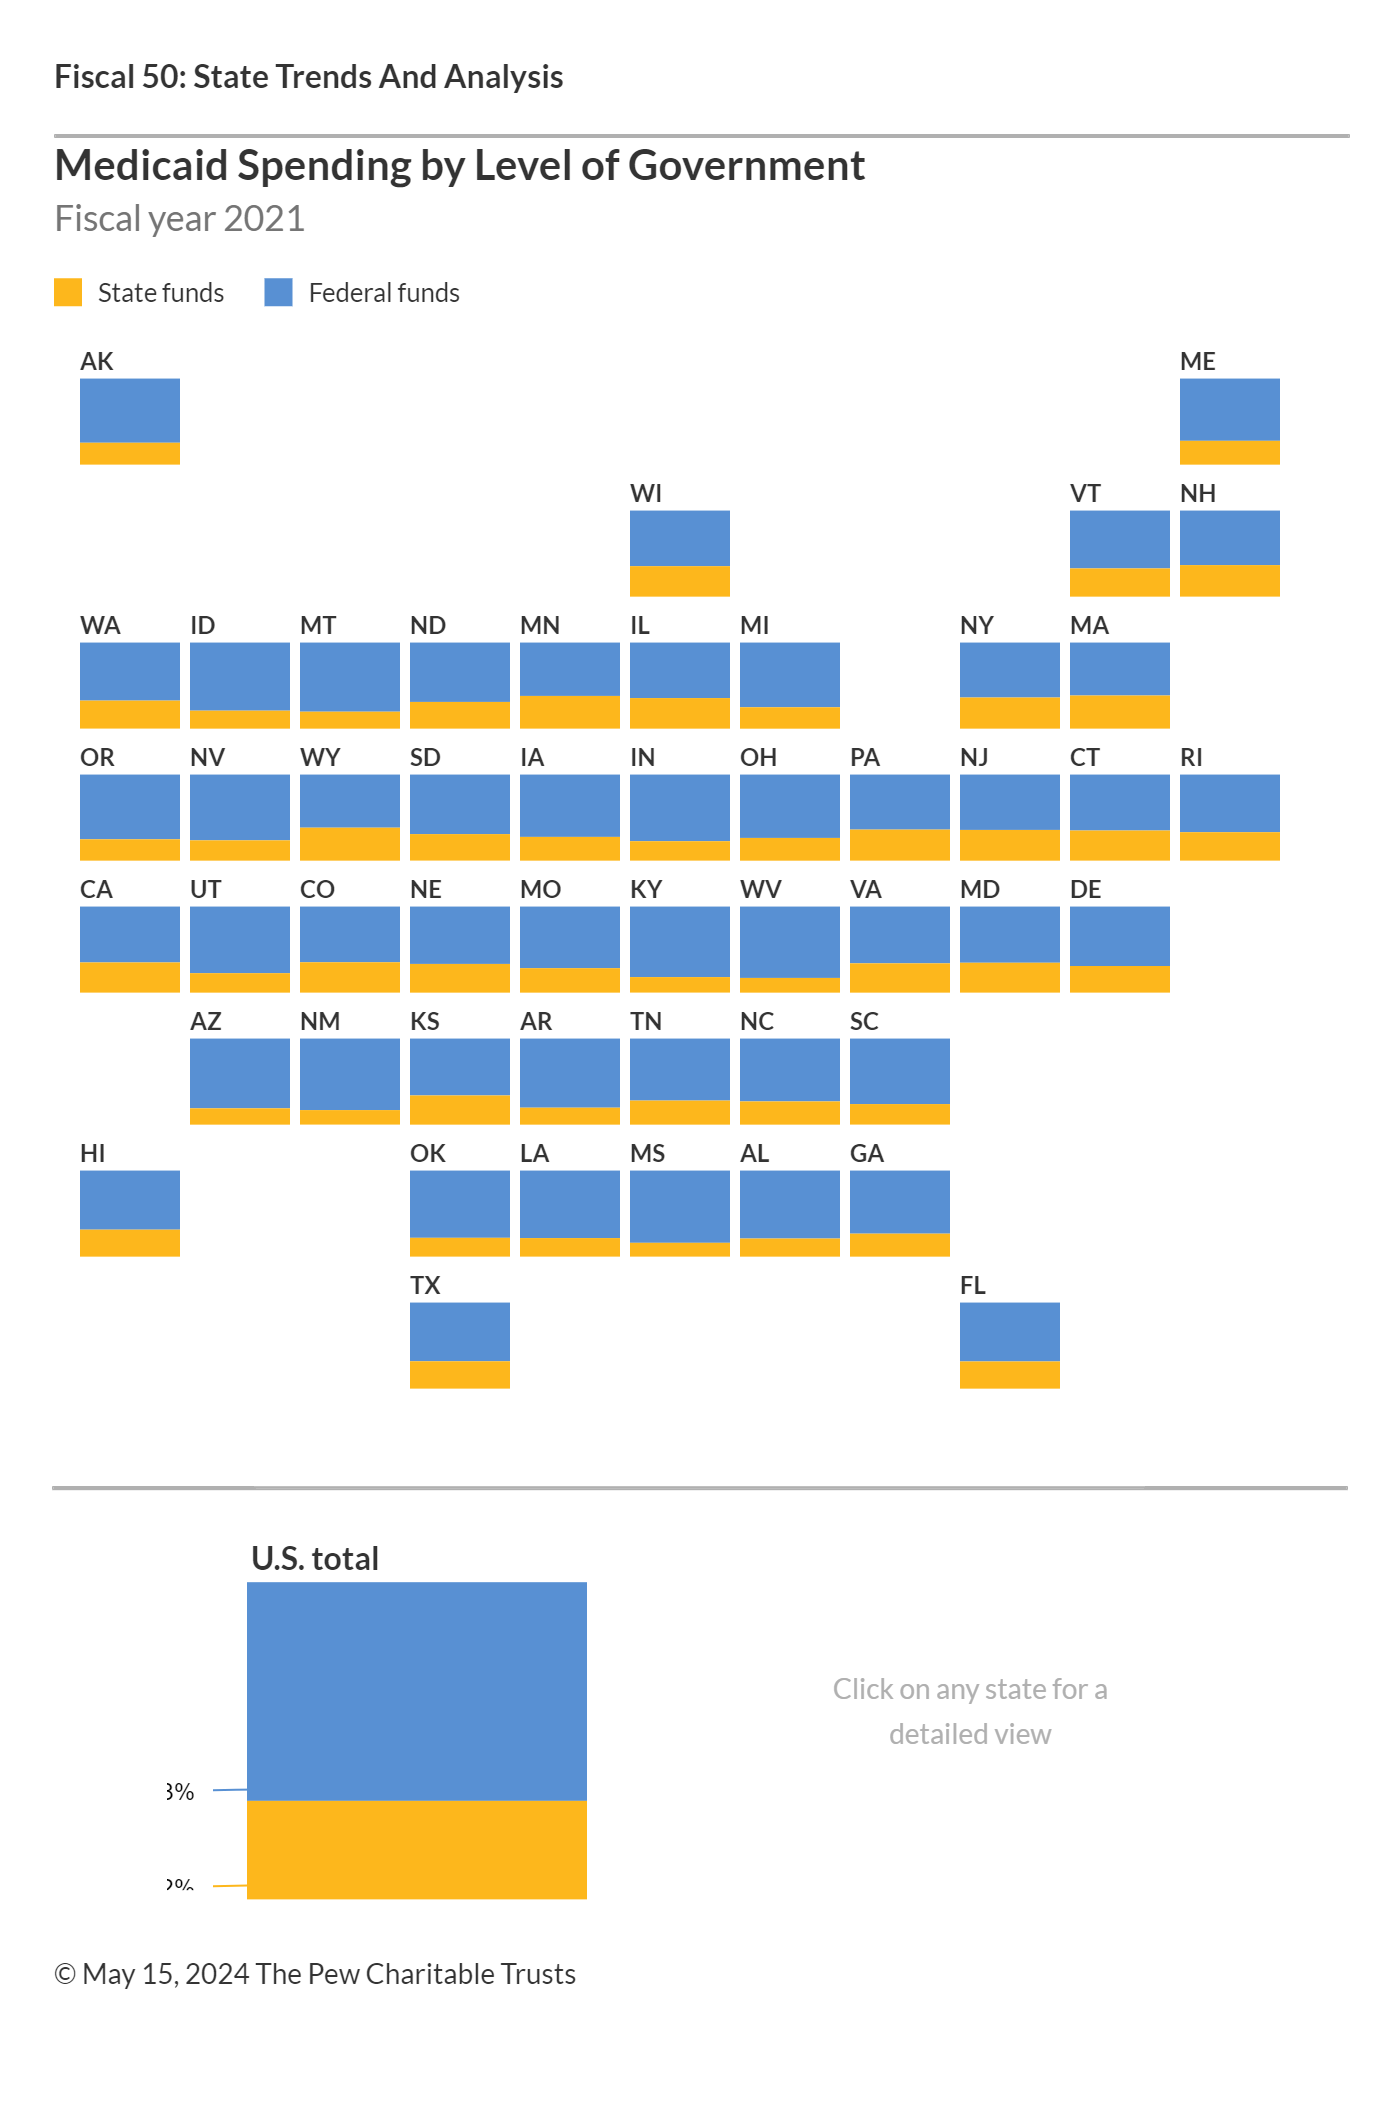
Medicaid is a state-administered program, but the federal government covered 60.3% to 83.5% of states’ bills for the program in federal fiscal 2021, for a total of 68% of costs. Federal spending on Medicaid grew by 12.5% that year, from $455 billion to $512 billion—the second consecutive double-digit annual increase since temporary enhanced federal aid was provided in early 2020.
The federal government covered the highest portion of state Medicaid costs in Mississippi (83.5%), New Mexico (82.6%), West Virginia (82.4%), Kentucky (81.4%), and Arizona (80.4%), and the lowest in New York (62.8%), New Hampshire (62.3%), Minnesota (60.9%), Wyoming (60.6%), and Massachusetts (60.3%).
Sources: Pew analysis of data from the Centers for Medicare & Medicaid Services, the National Association of State Budget Officers, and the U.S. Census Bureau.
Influence of Federal Policy Changes
Recent changes in federal policies have significantly affected states’ financial responsibilities for Medicaid. In response to the economic challenges of the COVID-19 pandemic, the federal government increased the federal medical assistance percentage (FMAP) for Medicaid by 6.2 percentage points for the duration of the public health emergency. The enhanced FMAP, which was initially set to end on April 1, 2023, underwent a gradual phaseout throughout the 2023 calendar year, decreasing to 5% on April 1, 2.5% on July 1, 1.5% on Oct. 1, and concluding on Dec. 31.
As a condition of these enhanced federal funds, states were prohibited from removing individuals from their Medicaid programs, which lead to a surge in enrollment—from 71.1 million in February 2020 to 94.1 million by April 2023, a 32.4% increase.
The Consolidated Appropriations Act (CAA), which became effective March 31, 2023, marked the end of continuous Medicaid enrollment and allowed states to initiate unenrollment beginning in April 2023. At least 19.6 million Medicaid enrollees have been unenrolled as of April 4, 2024, according to the Kaiser Family Foundation. The CAA also initiated the phaseout of enhanced federal matching funds that concluded in December.
The federal government previously provided extra dollars to states to help cover the increased costs of higher Medicaid enrollment and declining state tax revenue associated with the 2001 and 2007-09 recessions. As the enhanced federal aid from the Great Recession tapered off between December 2010 and June 2011, states’ share of Medicaid costs spiked while their tax revenue was still recovering.
Since January 2014, the ACA has also provided an opportunity for states to expand their Medicaid programs with enhanced federal support. The law initially required states to expand Medicaid eligibility to all adults under age 65 who earn up to 138% of the federal poverty level, a change that the U.S. Supreme Court later ruled was optional for states. For states that chose to expand their coverage to this broader population, the federal government agreed to reimburse 100% of the expansion costs through 2016, then 95% of costs in 2017, and ultimately 90% from 2020 onward. As of the fiscal year that ended June 30, 2021, the time frame for this analysis, 36 states had expanded their programs in accordance with the ACA. Another four states had done so as of March 2024.
States that have expanded Medicaid coverage have typically drawn from their general funds to cover their share of the bill, and some have been able to offset the added costs with related budget savings, such as reductions in behavioral health spending. Several states also report using new or increased provider taxes and fees to help fund the expansion.
In 2006, the federal government began relieving states of prescription drug costs for “dual eligibles,” people who qualify for Medicaid and the federal Medicare program. In return, states must share some of their savings with the federal government through annual “clawback” payments, which are included in this analysis as part of state Medicaid spending.
However, the amount of federal reimbursement that states receive is just one of several factors that influence the wide range in the share of state’s own revenue spent on Medicaid. Among the other drivers are state Medicaid policy decisions—the breadth of health care services covered, eligible populations, and provider payment rates—and each state’s personal income levels. States with lower per capita income have higher federal reimbursement rates, and vice versa. The variation across states also is a function of tax and other policy decisions that determine state revenue and factors outside of policymakers’ direct control, such as state economic performance, demographics, resident health status, and regional differences in health care costs and practices. (For more information, see “State Health Care Spending on Medicaid.”)
Why Pew Assesses State Medicaid Spending
State Medicaid spending has a significant impact on state budgets. As the largest expense for most states after K-12 education, Medicaid's allocation from each revenue dollar directly influences the resources available for other key public services, such as education, transportation, and public safety. The federal government requires states to, among other things, provide matching funds to help cover the costs of Medicaid benefits for eligible enrollees, regardless of revenue conditions. This relative lack of state control over costs distinguishes Medicaid from many other programs and can be difficult for policymakers to navigate, especially when costs spike during economic downturns.
Justin Theal is an officer and Riley Judd is an associate on The Pew Charitable Trusts’ Fiscal 50 project.
NEXT STORY: Why income discrimination laws hurt poor renters