How to consolidate alarm information for data center visibility


Connecting state and local government leaders
Using data integration techniques and effective visualizations, data center managers can see facility and equipment alarms in a single dashboard.
Data center managers need ready information on energy usage, cooling operations and IT optimization. That historical data must first be consolidated across the network and normalized before it can produce the reporting and analytics that drive actionable decision making.
Likewise, data center operations managers want all alarms for all equipment consolidated into a single view for “real time” alerts and predictive analysis. But alarm consolidation takes a unique approach to gathering, transferring and visualizing information.
Enterprise alarming system
When considering an enterprise alarming system (EAS), two key points to consider are speed and reliability. In order to get the best response time from the local equipment or software to the enterprise view or dashboard, delays throughout the entire architecture must be mapped.
In terms of speed, managers must decide what is fast enough and what is “real time” – a term often interpreted quite differently depending on the individual using it. In most cases, a “semi-real time,” which is defined as two minutes or less, is a viable target when designing a consolidated alarm architecture, which might include some latency caused by alarm data coming from several different systems in many geographic regions. At the local level, however, measurements of seconds vs. minutes would be required.
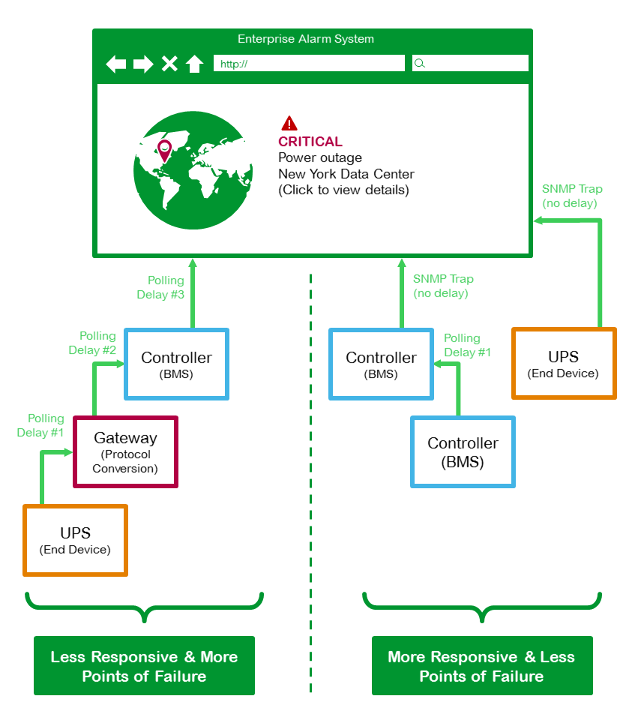
To optimize the speed of alarm annunciation, an EAS can reduce the polling of alarms and data transfers between separate systems by creating its own high level alarms and reading the data directly from the end devices or gateways. The disadvantage is that duplicate alarms are needed: one alarm at the local level and then other in the EAS. If the EAS does not support a certain field bus protocol, then a gateway would need to be installed for translation.
One of the better options would be to leverage features such as SNMP traps, which are notifications sent from managed devices via the Simple Network Management Protocol. The SNMP trap contains descriptive information about the alarm and is sent immediately after the alarm occurs. The EAS receiving SNMP traps could eliminate polling delay. See the high level visual representation below.

Gathering alarm data
If it is necessary to install a gateway for gathering alarm data because of required protocol conversion or creating SNMP traps, there are several gateways to choose from in the open market. But before choosing a gateway, a few key items should be confirmed:
Protocol conversion. Is the conversion BACnet to Modbus or BACnet to SNMP? Check also if the data is translated from a proprietary protocol to a more open protocol, which would require gateway from the specific vendor.
Number of alarm points to transfer. A gateway’s performance can be severely impacted if too many alarm points are translated. Best practice would be no more than 1,000 points per gateway depending on the polling frequency (1-5 minutes) of alarm data.
Setup and maintainability. Some gateways require complex setup, so care should be taken in determining how many steps are required for mapping data points from the originating protocol to the target protocol. Keep in mind that an update to the configuration may be needed each time a point is added to the system.
Visualization
Being creative with the presentation of alarms is one of the most enjoyable parts of the project.
Be sure that the visualization software being used is flexible enough to create a hierarchy of alarm detail, ranging from a global overview to the equipment level. The alarm workflow should provide “drill down” capability to each level below.
The global overview would typically be a world map with all sites geographically located. Start with colors representing status of active alarms within each site. Then, drill down into each site to the building floor layout and then to specific rooms or equipment. Each hierarchy level can list as much detail regarding active or historical alarms as desired, including date/time of pickup, drop out, trigger value and notifications, to name a few.
Seeing facility and equipment alarms all in one place is not impossible. Many successful integrations leading up to a single dashboard of alarms is possible; these few points may provide some inspiration.
NEXT STORY: 5 cities win AWS City on a Cloud challenge


