Is America's Deficient Bridge Problem Getting Better or Worse?

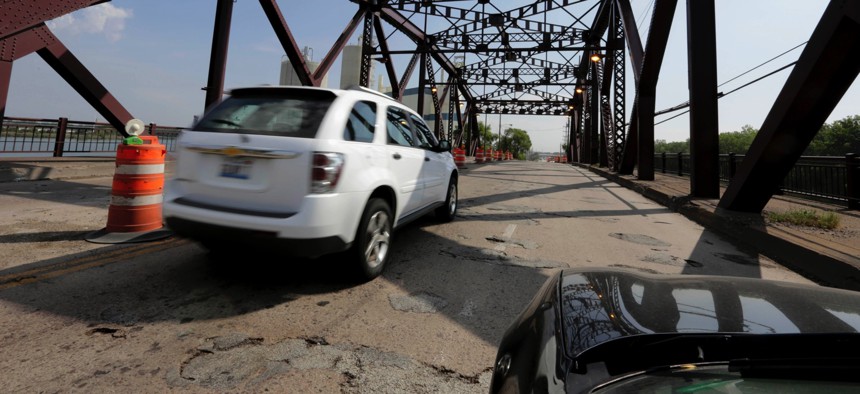
In this Sept. 11, 2013 file photo, vehicles drive on the 130th St. bridge over the Little Calumet River in Chicago that was classified as both "structurally deficient" and "fracture critical" in federal data for 2012. M. Spencer Green / AP File Photo
Federal data show the number of "structurally deficient" bridges in the nation has declined since 2005. But about 60,000 still need critical repairs.
Although about 10 percent of the nation's bridges were considered "structurally deficient" in 2014, the number and proportion of the overpasses falling into that category has shown moderate, but steady declines in recent years, according to figures from the U.S. Department of Transportation.
Nationwide, 61,030 of 607,013 bridges were deemed structurally deficient as of last year, according to figures in the 2015 edition of the Transportation Department's "State Transportation Statistics," a report issued on Nov. 13. The bridge data were first released earlier this year. In contrast to these latest numbers, figures for 2005, included in a previous copy of the report, show that of 592,473 bridges, 75,621 were structurally deficient.
Those numbers signal progress. But some states, such as Pennsylvania, Iowa and Oklahoma, have no shortage of overpasses in need of attention, based on the Department of Transportation statistics. Each of those states are shown as having had over 4,000 structurally deficient bridges during 2014. And there are other states that aren't far behind. Pennsylvania, last year, entered into a public-private partnership in an effort to get hundreds of aging bridges there replaced.
Classifying a bridge as structurally deficient does not mean it is on the verge of falling down, or that it's unsafe. But it can indicate that important components of the structure are in rough shape, typically requiring extra maintenance or repairs, and that heavy rehabilitation, or total replacement should be on the horizon.
Another undesirable classification for bridges is "functionally obsolete." In 2014, 13.7 percent of the bridges in the U.S., or 83,399, were categorized this way. Simply put, the classification means that an overpass does not meet modern design standards. This could be for a variety of reasons. For instance, shoulder-widths that were acceptable in the 1930s might be considered unsafe for modern traffic. Something like this would contribute to a bridge's functional obsolescence.
The number of functionally obsolete bridges has increased in recent years.
In 2010, it was 76,543, or around 12.7 percent of the total bridges included in the Department of Transportation statistics. That was 1 percent lower than the 2014 figure.
Structural deficiency is viewed as a more critical problem than functional obsolescence by the Department of Transportation, according to materials explaining the two terms.
The following pair of charts displays changes in the number, and percent, of U.S. bridges considered structurally deficient, and functionally obsolete, for select years between 2005 and 2014. The total number of bridges included in the data has climbed during that time from the 592,473 recorded in 2005, to the 607,013 chronicled in 2014.


How Do States Rank?
The Department of Transportation statistics also offer a window into which states had the most bridges that were structurally deficient or functionally obsolete last year.
The charts below rank states based on structurally deficient bridges.
Looking at both total numbers, and percentages, Pennsylvania comes out near the top of the structural deficiency list. Of the 22,430 Keystone State bridges included in the statistics, 5,049, or about 22 percent, were marked down as structurally deficient last year. Another 4,388, or roughly 19 percent, were considered functionally obsolete.
Iowa also had plenty of bridges that needed work, with 5,022, or just over 20 percent, classified as structurally deficient. That figure was 4,216 in Oklahoma.
In the first chart are total numbers for structurally deficient and functionally obsolete bridges. The second chart shows what percent of the total number of bridges in each state falls into those categories.
Again, these data are for 2014. It's possible the number of bridges falling into a given category has changed since then.


The Keystone State's Rapid Bridge Replacement Project
Faced with thousands of ailing bridges, Pennsylvania is aiming to get over 500 of them replaced with new ones through a public-private partnership forged last year.
Under the terms of the deal, a consortium of companies—known as Plenary Walsh Keystone Partners—is supposed to replace 558 bridges in the state by 2017. The vast majority of these bridges were structurally deficient, according to Pennsylvania Department of Transportation spokesperson Erin Waters-Trasatt.
Many of the bridges, she said, are in rural areas and consist of relatively simple designs.
"What we found through some smaller pilot projects is that when you bundle the design and construction of bridges, you can realize savings and it's more efficient," Waters-Trasatt explained on Monday. "You can use one design, you can buy in bulk quantities."
Other state bridge repair and replacement efforts are continuing in Pennsylvania during the course of the public-private partnership.
Following the construction phase of the project, the contract calls for Plenary Walsh Keystone Partners to maintain the bridges for 25 years. But Pennsylvania will retain ownership of the structures.
The group of companies is also responsible for the upfront financing of the project, and is compensated by the state as work is completed. Construction and design costs are roughly $899 million, according to Waters-Trasatt.
At least 18 of the new bridges are open to traffic, she said, adding that construction is underway on dozens of others.
Correction: An earlier version of this story mis-stated the difference between the percent of U.S. bridges that were functionally obsolete in 2010 and 2014. The difference was 1 percent.
Bill Lucia is a Reporter for Government Executive's Route Fifty.
NEXT STORY: Factors Influencing the Number of Alternative Driver's Licenses Issued by States


