Segregation Has Grown Worse in Most Big Metros, Analysis Finds

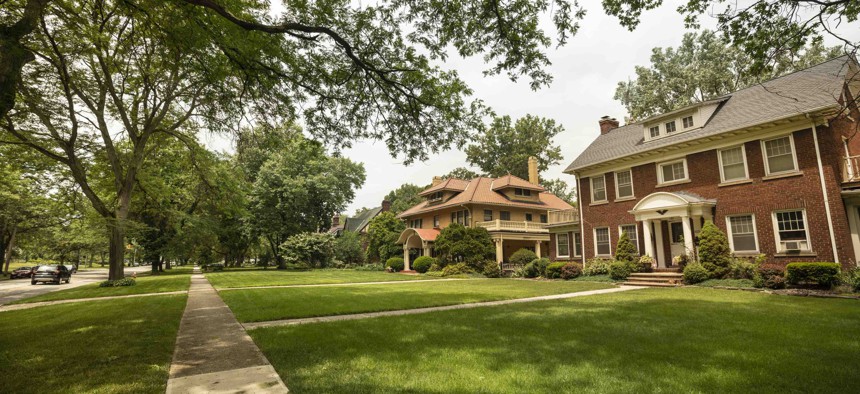
Housing in Cleveland, Ohio. iStock.com/Pgiam
"These findings were as startling as they were disturbing," says one of the study authors.
The vast majority of larger U.S. metropolitan areas have become more segregated over the past two decades, according to an analysis released on Monday.
A team at the University of California at Berkeley conducted the study, which shows that 81% of metro regions with more than 200,000 residents—or 169 out of 209—were more segregated in 2019 than in 1990.
The research also indicates that when it comes to measures like poverty rates, individual earnings, property values and levels of home ownership, segregated communities of color fare worse than white neighborhoods, or areas considered to be more well-integrated.
For instance, the report says that neighborhood poverty rates in segregated communities of color, at 21%, are three times higher than the 7% rate found in segregated white neighborhoods.
Likewise, the research suggests that Black children raised in integrated neighborhoods earn nearly $1,000 more annually as adults compared to those raised in highly segregated communities of color. That earnings differential increases further, to $4,000, for Black children who grew up in white neighborhoods.
"These findings were as startling as they were disturbing," said Stephen Menendian, the lead author of the project. "Although the American public has much greater awareness of the reality of systemic racial inequality, too few people understand that racial residential segregation lies at the heart of this inequality," he added.
The research, part of a broader project examining housing segregation in the United States, comes as many communities around the country are dealing with shortages of affordable housing and rapidly climbing home prices.
Menendian and co-author Samir Gambhir say their work improves on past attempts to analyze residential segregation by using a relatively new technique to measure it. They offer detailed information on the measures they used, and why they're an improvement from alternatives, in an appendix that is part of Monday's release.
The report also provides breakdowns of which places have seen the greatest increases and decreases in segregation between 1990 and 2019, as well as the metro areas where levels of segregation are highest and lowest.
"Our nation’s largest cities and metropolitan areas remain highly segregated using any measure, but the rustbelt cities of the industrial Midwest and mid-Atlantic disproportionately make up the top 10 most segregated cities list, which includes places like Detroit, Cleveland, Milwaukee, Philadelphia and Trenton," the report notes.
"The most segregated regions are the Midwest and Mid-Atlantic, followed by the West Coast," it adds, "Southern states have lower overall levels of racial residential segregation, and the Mountain West and Plains states have the least."
The project also features an interactive map that the study authors describe as the "most sophisticated interactive racial segregation mapping tool ever created."
UC Berkeley's Othering & Belonging Institute will hold an event on Tuesday where the study authors and others will discuss the research. Registration information is here. The study can be found here.
Bill Lucia is a senior editor for Route Fifty and is based in Olympia, Washington.
NEXT STORY: 3 Essential Elements Governments Need to Expand Broadband


