The Chart That Toppled San Diego's Long-Term Transportation Plan

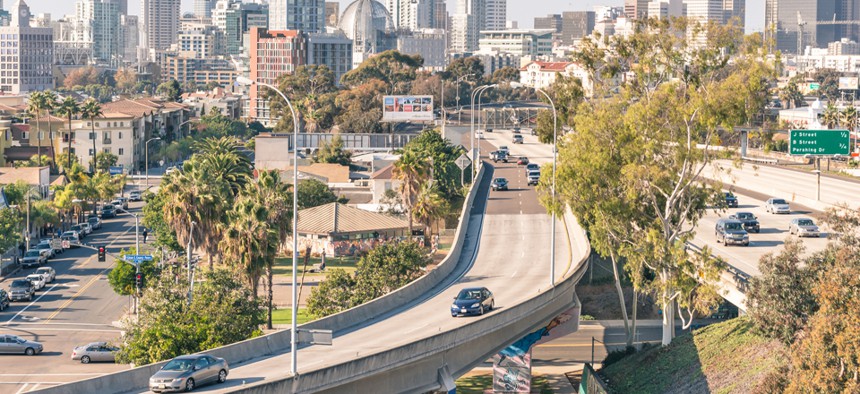
View Apart / Shutterstock.com
And could strengthen climate policies in California cities for years to come.
Late last month, a California appeals court upheld an earlier decision that undermined San Diego's massive, $214 billion plan for regional mobility through the year 2050. The ruling is expected to be appealed, but if it holds, the metro area's entire highway and transit network might be transformed as a result. And as if that weren't enough, the precedent would also strengthen climate policy in California cities for years to come.
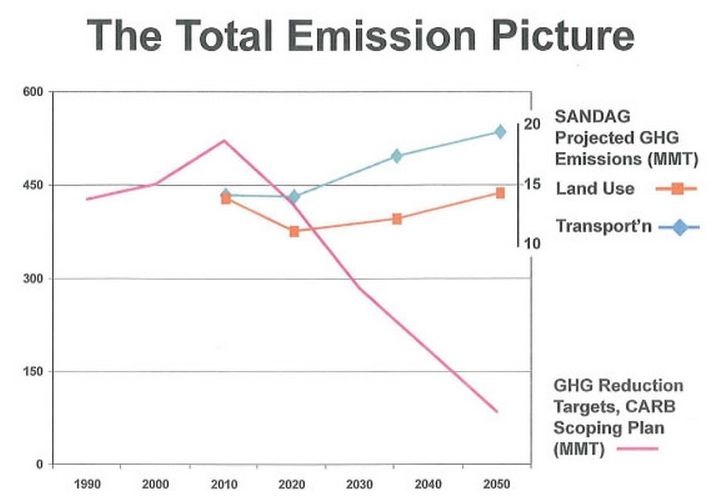
It's a big case. It's also a very complicated one, with lots of environmental, legal, and transportation-related ins, outs, and what-have-yous. Fortunately, the gist can be boiled down into this one rather ordinary-looking chart :

What you're looking at, broadly speaking, are emissions trends from 1990 to 2050. The purple line, rising through 2010 then falling dramatically, represents California's preferred outlook. By 2050, the state hopes to cut greenhouse gas levels by 80 percent of their 1990 levels—as spelled out in an executive order signed in 2005 by then-Governor Arnold Schwarzenegger.
Contrast that with the emissions trends forecasted in San Diego's long-term transportation plan, crafted by the San Diego Association of Governments, known as SANDAG . After a brief dip in SANDAG's plan, emissions from new land-use (in orange) and transportation (in blue) patterns steadily creep back up over time, such that by 2050 they're either at or above current levels. It's the complete opposite of everything the state hopes to achieve.
Opponents of SANDAG's plan have used the chart to support their case at every stage of their fight—in public comments, legal briefs, even court sessions. Rachel Hooper of Shute, Mihaly & Weinberger, an attorney for the winning side, says what's so nice about the chart is that it provides a striking, instantaneous clarity to an issue that might otherwise be tricky to explain and overloaded with numbers. Better yet, neither side involved in the case disputes any of the figures the chart depicts.
"It's very dramatic, isn't it?" she says.
The chart, developed by climate advocacy SanDiego350.org , was submitted to SANDAG in October 2011 during the initial public feedback period for the 2050 plan. SANDAG presented its plan as a balanced vision of highway improvements matched with transit expansion. But opponents (the state attorney general among them) said that by front-loading road projects, the plan ensured car dependency in the region for decades and ran counter to California's climate goals.
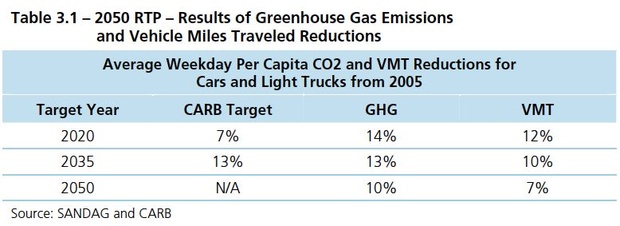
On that last charge, SANDAG's own numbers show that the 2050 plan meets the state's short-term emissions goals (established in a law known as S.B. 375). Greenhouse gases fall 14 percent by 2020 from current levels, and 13 percent by 2035. But by 2050, the plan estimates that emissions will have fallen just 10 percent, meaning for most of the plan's duration they'll actually be on the rise—the reason being an "increased demand for driving" as people moved into more remote areas of the region, according to SANDAG .

In late 2011, SANDAG opponents (including the state attorney general) filed suit over the 2050 plan. The emissions chart appeared in an opening brief to the superior court, which first heard the case, serving as evidence that San Diego's transportation plan stood in "dramatic conflict" with Schwarzenegger's 2005 executive order. The whole point of that policy, argued opponents, was to avoid the type of "unacceptable climate change" the 2050 plan promoted:
A graph submitted to SANDAG illustrates the stark contrast between emissions allowed by the Plan—still drifting upward through 2035 and 2050—and the steeply declining trajectory necessary for climate stabilization.
SANDAG countered that its plan met the 2020 and 2035 emissions targets (outlined in SB 375), and that it didn't have the same obligation to meet the 2050 target (outlined in the executive order). But Judge Timothy B. Taylor of the superior court disagreed. He found SANDAG "impermissibly dismissive" of the Executive Order that calls for emissions to fall by 2050, and argued that the policy was in place for a reason:
SANDAG thus cannot simply ignore it.
"I don't know if it was because of the chart, but I think the court certainly got the point that we have a big problem with this SANDAG plan," says Hooper, who recalls using the graph in a PowerPoint presentation during the trial. "Emissions are going up. It's in violation or in contradiction with the state climate policy. That's all over their decision."
The chart made another appearance in a brief when the case went to an appeals court, which upheld the superior court ruling in a 2-1 judgment issued this November. The majority cited the public's right to be informed of future climate consequences "before approving long-term plans that may have irreversible environmental impacts." In December, SANDAG's board voted to appeal the case once more, this time to the state supreme court.
Asked about that decision, SANDAG referred CityLab to a press release quoting board chair Jack Dale as saying the law needs further clarity "for every planning agency and city in California":
"Left unchallenged, this appellate court decision will make it even more difficult for agencies and cities to know which regulations to follow and what standards to apply," Dale said. "The confusion will result in slowing down all projects in the state—transit projects, bike projects, pedestrian improvements, and highway projects."
Despite coming at the case from the other side, Hooper agrees that its eventual conclusion will have huge implications for how municipal planning organizations in California design long-term regional transportation plans. "Remember, these are plans that are in place for 30 or 40 years," she says. "What is heartening about this decision is the court is making sure they look at the impacts of the whole of the plan for all of those decades. Including on climate."
It's fair to say the future of San Diego's transportation network hangs in the balance. Construction is reportedly scheduled to begin next year on one facet of the 2050 plan—a $6.5 billion suite of projects that begins with an expansion of Interstate 5. But Hooper says she's filed suit against this work in the San Diego Superior Court, and that the expansion could be halted if her side wins.
As for the long-term plan itself, SANDAG may eventually have to go back to the drawing board. Opponents have urged SANDAG to analyze the environmental impact of a so-called "50-10" plan that front-loads transit projects into the first decade. (SANDAG has called that idea implausible on funding grounds.) If existing alternatives don't pass environmental muster, SANDAG could theoretically have to reverse engineer a plan beginning with the 2050 climate target.
For now, says Hooper, all eyes are on a revision that SANDAG is currently doing as part of a mandatory four-year update for long-term regional plans. "The hope is they'll kind of get the hint here," she says. If not, there's a certain chart it's safe to assume they'll be seeing again.
(Top image via View Apart / Shutterstock.com )


