America's Best Performing Cities in 2014
kropic1/Shutterstock.com
The knowledge and energy hubs of San Francisco and Texas are among the year’s biggest economic winners.
The U.S. economy continues to recover from its Great Recession: The Economist reported this month that 2014’s third quarter saw 5 percent GDP growth, the fastest pace since 2003. But the recovery has been uneven, with the affluent benefitting disproportionately while working people and the middle class have fallen further behind.
The recovery has also been uneven across cities and metro areas, the real underlying engines of American economic growth. The latest evidence of this phenomenon can be found in the 2014 edition of the Milken Institute’s Best Performing Cities , released today. An outcomes-based ranking, the study rates some 200 large and 179 small metros on several key measures: job growth, wage and salary growth and the size and concentration of high tech industry. The study shows how the recovery has been concentrated in—and, indeed , has revolved around—what I have dubbed the twin pillars of America’s knowledge/energy economy, with the best performers being energy centers and tech hubs.
The table below, from the report, shows the 25 top performing metros in 2014 and compares their performances to the 2013 rankings.
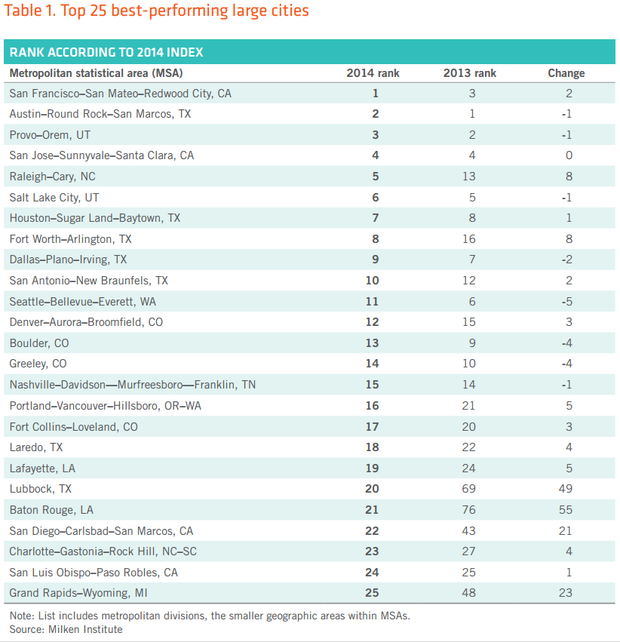
The top performing metro this year is San Francisco, up from third place last year. It’s yet another indicator of the ongoing shift to urban tech. Indeed, this is the first time that San Francisco has topped the list in its 15-year history, outdistancing Austin, last year’s top performer (now number two), and San Jose, in the heart of Silicon Valley (fourth place). As the report’s author, Ross DeVol, pointed out in an email, “From 2008 to 2013, professional, scientific, and technical services created 25,500 jobs in San Francisco—45 percent of total job creation over that period! The median wage for these professions was $91,400.”
The top six best performing metros were all tech hubs: The previously mentioned three, plus Provo, Utah; Raleigh-Cary in North Carolina’s Research Triangle; and Salt Lake City. Rounding out the top ten were four Texas cities: Houston, Fort Worth, Dallas and San Antonio. Other tech powerhouses in the top 25 include Seattle at 11 and Boulder at 13.
Energy centers also rank high up the list. This is evident in the strong showing of metros in the Lone Star State, home to seven of the top 25 best performing metros, and five in the top ten. The energy economies of Lafayette (19) and Baton Rouge (21), Louisiana, also place in the top 25 of large metros, the latter of which rose 55 spots in ranking last year alone.
But not all the news is good. Many so-called "Rustbelt" metros continue to underperform. Detroit is 193rd in the ranking, down 26 spots from last year, Akron is 152, Toledo is 151 and Cleveland is 133. Fortunately, there are some exceptions to this rule, but these are more post-industrial economies like Indianapolis (26) and Columbus, Ohio (41), or college towns like Madison, Wisconsin (30), and Ann Arbor, Michigan (59). Grand Rapids, Michigan (25), with its world-class office furniture cluster composed of Steelcase and Herman Miller, and nearby Holland, Michigan (29), also perform quite well.
Sunbelt metros, which were once powered by capitals of sprawl and housing-driven “growth without growth,” also continue to lag: Phoenix ranks 65th and Las Vegas 144th.
Of the nation’s three largest metros, New York is 62nd, Los Angeles 42nd and Chicago 97th. Greater Washington, D.C., which performed well over the course of the recession, has sunk to 84th, down from 45th last year .
*****
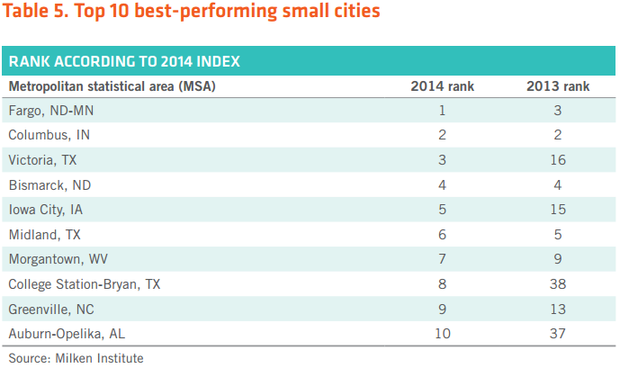
The ranking of the 179 smallest metros similarly reflects the contours of America’s knowledge-energy economy. Fargo, North Dakota-Minnesota, which has grown on the back of fracking activity, comes out on top. Energy is also the main economic driver in Victoria, Texas (3), Bismarck, North Dakota (4), and Midland, Texas (6). As the report notes, many of the top-performing small metros have economies that revolve around the horizontal drilling and hydraulic fracturing sectors. Such energy sector growth also spurs demand for infrastructure investment, construction and transportation, generating further economic development.
The college towns and knowledge hubs of Iowa City (5, home to the University of Iowa), Morgantown, West Virginia (7, West Virginia University), College Station, Texas (8, Texas A&M), and Auburn, Alabama (10, Auburn University) also rank highly.
*****
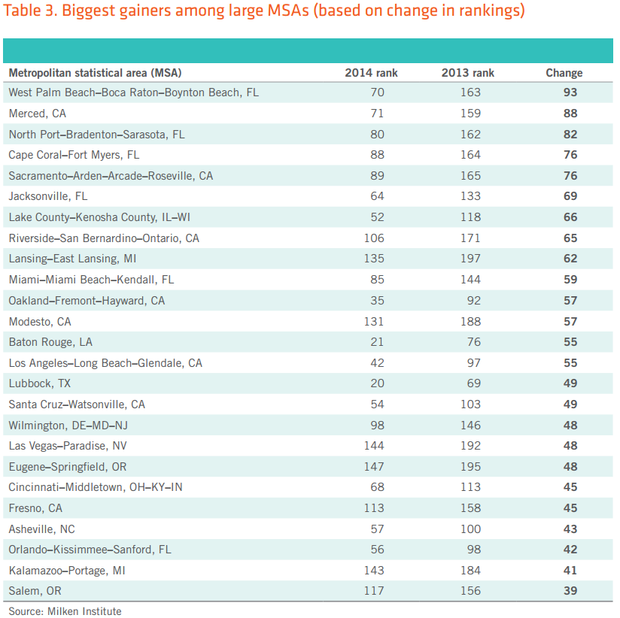
The table below, also from the report, shows the metros that have seen the biggest moves up the rankings in the past year. The good news is that a number of once-struggling Sunbelt and Rustbelt metros have seen some improvement . Among the biggest gainers are rebounding vacation and second home destinations, such as West Palm Beach-Boca Raton-Boynton Beach, which shot up 93 spots since 2013. Among large metros (over one million people), Miami, L.A., Las Vegas, Cincinnati and Orlando rank among the top 25 biggest gainers over the past year.
*****
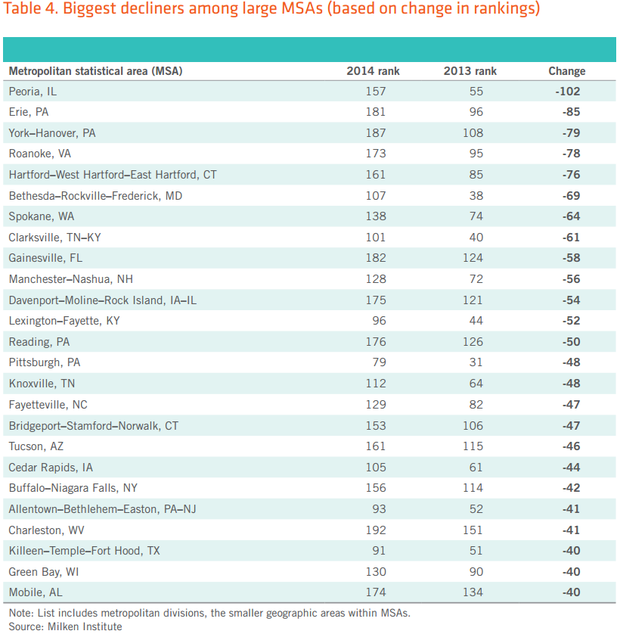
More troublingly, the metros that registered the biggest declines (see the table below) underscore the continued hollowing of the heartland alongside parts of the Sunbelt. Peoria, Illinois, racked up the biggest annual decline, followed by Erie and York, Pennsylvania; Roanoke, Virginia; Hartford, Connecticut; and, perhaps surprisingly, Bethesda, Maryland. Pennsylvania fares especially poorly, with five metros registering sizeable declines, including Pittsburgh (at 79, down 48 spots). As the report notes: “To some extent, longer-term subpar growth trends are reemerging, after having been masked during the Great Recession. Most of these metros have more service-based economies that didn’t experience as severe a decline as many with a greater reliance on manufacturing.”
*****
The Milken rankings can also be used to gauge the key factors that underpin the growth of U.S. metros. To get at this, my Martin Prosperity Institute colleague Charlotta Mellander ran a basic correlation analysis on this year's Milken rankings for the 200 large metros they studied. She matched up these data (supplied by the Milken Institute) to key factors like population, density, human capital (the percentage of adults that are college graduates), the share of knowledge, professional, and creative workers, and other measures of demographic and economic characteristics for each metro area. As usual, I note that correlation does not imply causation, and merely shows a relationship between variables.
Economists have increasingly argued that talent and human capital are key drivers of regional economic performance. And Milken’s rankings show a reasonably close association between talent and economic performance. The Milken Index is positively associated with both the share of adults that are college grads (.32) and the share of the labor force made up of knowledge, professional, and creative workers (.23). The type of talent is even more interesting: The Milken Index is more closely associated with arts and cultural talent (.35) than science and tech talent (.30) or business professionals (.24). And for all the talk of how “eds and meds” can help spur development, the Milken Index is negatively associated with “eds and meds” occupations (-.17).This reflects what the venture capitalist Fred Wilson told me in an interview a while back: He sees tech startups shifting from their previous engineering and hardware orientation to a broader, more urban focus, where entrepreneurs have characteristics that are more similar to artists.
The best performing cities also tended to be more open and diverse. The Milken Index is positively associated with both the share of population that is foreign born (.26) and even more closely with the share that is gay and lesbian (.42).
Best performing cities are larger (.22) and denser (.26). The way people get to work also matters. The Milken Index is negatively associated with the share of commuters who drive to work alone (-.31) and positively associated with the share of take public transit to work (.26).
The results also point to the connection between clustered and concentrated tech-driven economies and inequality, which I wrote about earlier this week . Metros that performed better on the Milken Index have higher levels of wage inequality (with a correlation of .28, though down from last year’s correlation of .34). However, the Milken Index is not statistically associated with income inequality, as measured by the Gini coefficient . Furthermore, while many – including me – worry that the increasingly high cost of housing threatens the success of leading creative centers, Mellander’s analysis finds no statistical association between the Milken Index and the share of income devoted to housing. While housing affordability clearly remains a serious problem in places like San Francisco or Manhattan, the good news is it does not appear to be a factor for high-performing cities and metros across the board.
*****
Ultimately, the report paints a clearer picture of America’s geographically uneven recovery, where tech hubs and energy centers prosper while older manufacturing and construction driven metros continue to falter. But there may be some dark clouds looming over the twin pillars of America’s knowledge-energy economy. Falling energy prices will likely put a damper on growth in many energy-driven metros. And leading urban tech centers like San Francisco are faced with rising housing prices and mounting inequality, which threaten to price out some of the very people who have driven innovation there in the first place. To determine how those factors play out, we’ll have to wait for next year’s ranking.
( Top image via kropic1 / Shutterstock.com )


