See What Your City Will Be Like in 15 Years

Atlanta is attracting a lot of new folks—specifically, young people and minorities. Rudy Balasko/Shutterstock.com
An interactive tool forecasts U.S. metro demographics circa 2030.
Minority populations will surpass the aging, white majority by 2042. New births, immigration, and internal migration will reconfigure the populations of our cities, towns and suburbs. The tectonic plates of America's demographics are shifting, and now there's an easy way to follow along.
A new interactive tool developed by the Urban Institute predicts how these changes will play out locally by 2030. Using historical trends and census data, it allows users to adjust for rates of birth, death, and migration to forecast a range of scenarios—so urban planners, local leadership, and anyone else can track the effects of demographic trends in their region.
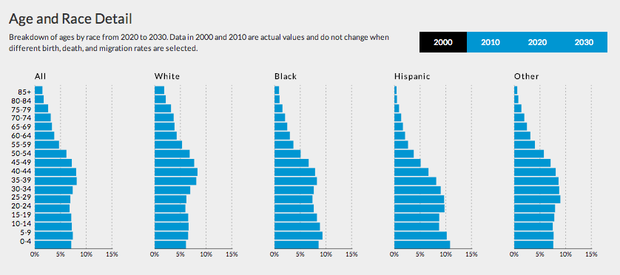
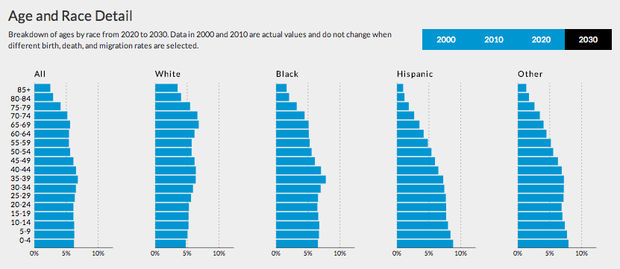
"Sometimes people's idea of what their community is like gets fixed at a fairly early age," says urban planner William Fulton, who formerly served as San Diego's planning director. "If you have statistical information ... it becomes more possible to have a conversation about how things are changing and what you’re going to do about it."
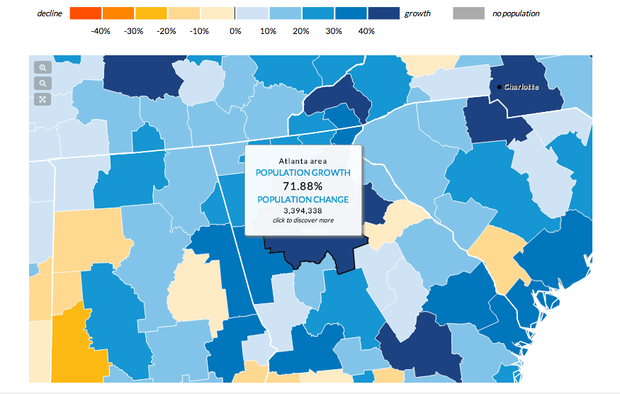
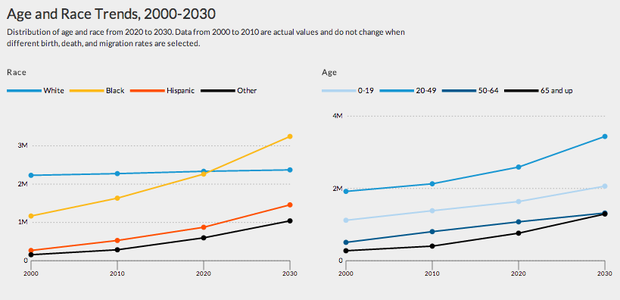
Take Atlanta, which is attracting a lot of new folks—specifically, young people and minorities. That shift makes sense: the city is located in the South, where a young Hispanic population is growing rapidly, and it's also a destination for African Americans seeking job opportunities in sectors drying up in cities like Detroit and Chicago. By 2030, the high rate of migration into the city could raise Atlanta's population by 72 percent. In response, city authorities will have to make sure local housing, schools, health care facilities, and public services meet the needs of new residents.
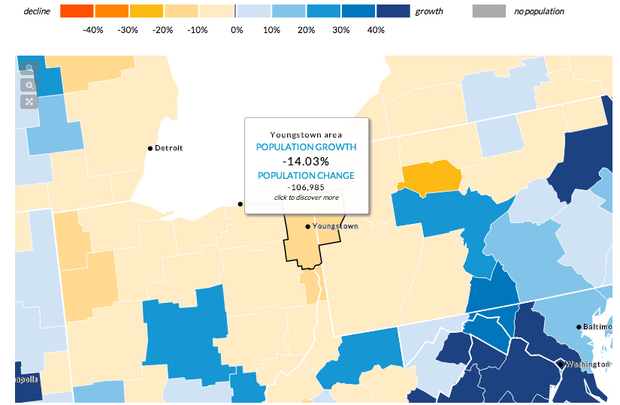
Other cities in the process of losing residents will face other problems: housing demand will fall, the labor force will weaken, and property and income tax revenue will shrink (challenges that places like Detroit are currently facing). Youngstown, Ohio, for example, may lose almost 15 percent of its residents if migration out of the city increases.
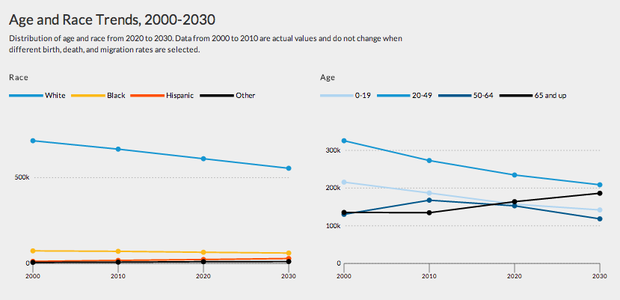
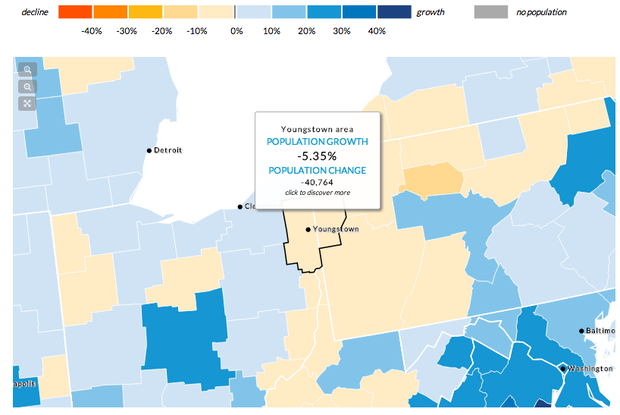
But if the migration rate slows down, only 5 percent of Youngstown's population will be lost.
The mapping tool gives a range of outcome so local governments can plan for what they know and account for what they don't . "Considering the range of what-ifs, it only makes sense to have tools that allow us to see how those many possibilities might affect the population landscape of the United States," says Rolf Pendall, d irector of Urban Institute's Metropolitan Housing and Communities Policy Center .
( Top image via Rudy Balasko / Shutterstock.com . Maps and graphics via Urban Institute. )


