America's Most Economically Segregated Cities
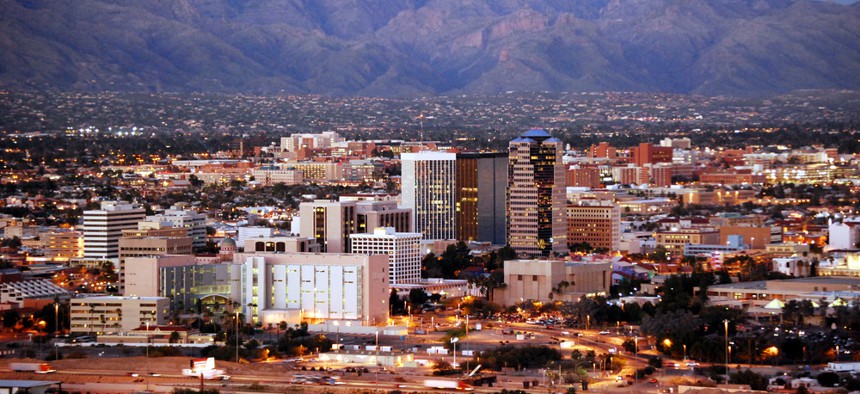
Tucson, Arizona is among the most segregated cities in the United States. Frontpage/Shutterstock.com
Can you guess what Tallahassee, Trenton, and Tucson all have in common?/
The geographical sorting of Americans by income, education and socio-economic class is growing. A 2012 report by the Pew Research Center [PDF] found that the segregation of upper- and lower-income households had risen in 27 of the country's 30 largest metros. Inequality is increasingly baked into the economic geography of the United States.
A year ago I authored a five - part series on the geography of economic segregation for this site. Now, in a new study released today by the Martin Prosperity Institute , my colleague Charlotta Mellander and I take another deep dive into the geography of economic segregation across U.S. metro areas to create a new kind of index of inequality.
While most studies of economic segregation focus on income , we look at economic segregation as the product of three factors that bear on socioeconomic class broadly: income, education, and occupation. Our measure of income segregation examines the segregation of the poor (households below the poverty level) and segregation of the rich (households with incomes over $200,000). Our measure of educational segregation reflects the segregation of non-high school grads (or adults with less than a high school diploma) and of college grads. Our measure of occupational segregation combines the segregation of the creative class, the service class (those with low-skill, low-pay service jobs), and the working class (those in blue collar jobs).
Our analysis develops seven individual and three combined measures of income, educational and occupational segregation, from which we cull our index of overall economic segregation. Our seven individual measures are based on the Index of Dissimilarity [PDF] developed by sociologists Douglas Massey and Nancy Denton, which compares the spatial distribution of a selected group of people with all others in that location, while the combined are based on metros' relative segregation rankings. Our research covers the more than 70,000 Census tracts that make up America’s 350-plus metros and is based on data from the U.S. Census and from the Bureau of Labor Statistics.
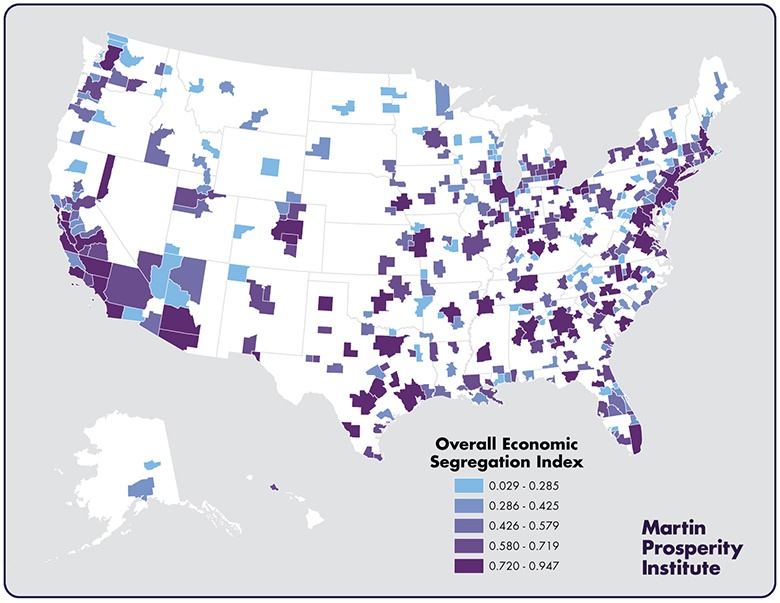
( Martin Prosperity Institute )
The map above charts our index of overall economic segregation across all U.S. metros. Notice that metros with high levels of segregation (in the deep purple) are generally clustered in areas like the southern West Coast, the Northeast, the Southeast and eastern and central Texas.
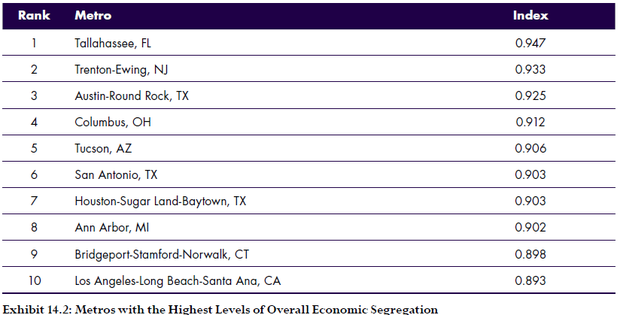
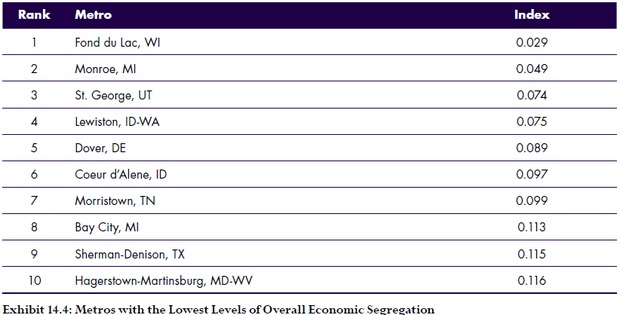
( Martin Prosperity Institute )
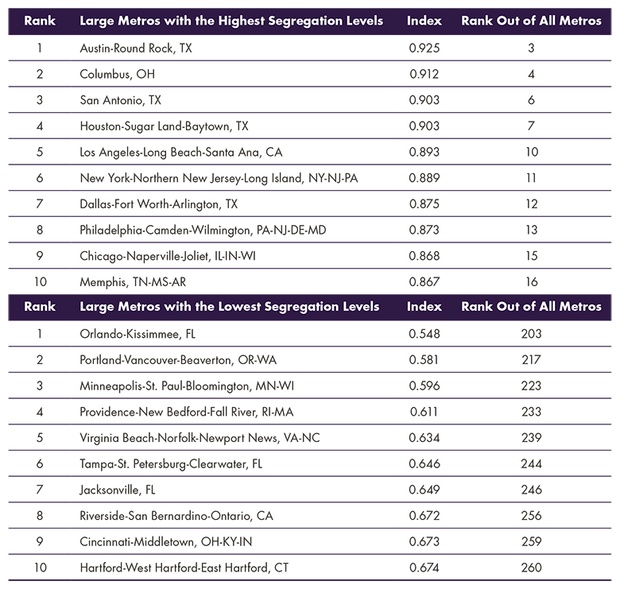
The tables above list the metros with the highest and lowest levels of overall economic segregation, while the tables below do the same for large metros (those with over one million people).
( Martin Prosperity Institute )
Tallahassee, Florida, and Trenton, New Jersey, have the highest levels of overall economic segregation in the U.S., followed by Austin, Tucson, San Antonio, Houston, Ann Arbor, Bridgeport, and Los Angeles.
Four of the ten most economically segregated large U.S. metros are in Texas: Austin, San Antonio, Houston, and Dallas. New York, Philadelphia, Chicago, and Memphis also exhibit high degrees of economic segregation. Almost all of the most segregated smaller metros are college towns.
The metros with the lowest levels of economic segregation are mainly medium-sized and smaller ones. More than 200 small and medium-sized metros are less economically segregated than even the least segregated of the 51 largest metros. The ten least segregated metros all have 300,000 people or less.
The least segregated large metros include Orlando; Portland, Oregon; Minneapolis-St. Paul; Providence, Rhode Island; and Virginia Beach. Rustbelt metros like Cincinnati, Rochester, Buffalo, and Pittsburgh also have relatively low levels of economic segregation.
Ultimately, all three types of segregation—income, educational, and occupational—are associated with one another. If a metro is segregated on one dimension, it increases the likelihood of it being segregated on the others.
*****
We also conducted a detailed statistical analysis to uncover the key social and economic factors that bear on economic segregation. Our key findings are as follows:
Size and Density
Economic segregation is positively associated with population size and density. It is also positively correlated to factors that follow from metro size and density: how people commute to work and the share of liberal and conservative voters.
Knowledge Economies
Economic segregation tends to be more intensive in high-tech, knowledge-based metros. It is positively correlated with high-tech industry, the creative class share of the workforce, and the share of college grads. In addition, it's associated with two key indicators of diversity, the share of the population that is gay or foreign-born, which both tend to coincide with larger, denser and more knowledge-based metros.
Wealth and Affluence
Economic segregation is connected to the overall affluence of metros, with positive correlations to average metro wages, income, and economic output per capita.
Race
Race is a significant factor. Economic segregation is positively associated with the share of population that is black, Latino, or Asian, and negatively associated with the shares of white residents.
Inequality
Economic segregation is associated with income inequality and even more so than with wage inequality. Its effects appear to compound those of economic inequality and may well be more socially and economically deleterious than inequality alone.
When all is said and done, our analysis finds economic segregation to be related to the location decisions of more advantaged groups. The creative class is more segregated than either the working class or service class. College grads are more segregated than those who did not graduate from high school. The wealthy are more segregated than the poor—indeed they are the most segregated of all, and by a considerable margin.
*****
A decade or so ago, Bill Bishop noted how talented and educated people were concentrating more in some places than others, a tendency he dubbed “ the big sort .” The big sort has now become an even bigger sort. America’s cities and metropolitan areas have cleaved into clusters of wealth, college education and highly-paid knowledge-based occupations that are strikingly different from its concentrations of poverty, low levels of education, and poorly-paid service occupations.
Where cities and neighborhoods once mixed different kinds of people together, they are now becoming more homogeneous and segregated by income, education, and occupation. In separating metro-dwelling Americans across these three key dimensions of socio-economic class, this bigger sort threatens to undermine the essential role that cities have played as incubators of innovation, creativity, and economic progress.
It is not just that the economic divide in America has grown wider; it’s that the rich and poor effectively occupy different worlds, even when they live in the same cities and metros.
( Image via Frontpage / Shutterstock.com )


