Inequality Keeps Creeping Higher in America's Largest Cities

Mark Winfrey/Shutterstock.com
A new analysis finds that the largest cities in the U.S. are also some of its most unequal, now more than ever.
Economic inequality across America’s large, coastal cities continues to deepen, according to a new study released this week by the Brookings Institution. The study, by Alan Berube and Natalie Holmes of Brookings’ Metropolitan Policy Program, calculates inequality based on what they dub the “95-20 ratio.” This method compares the income of the top 5 percent to the bottom 20 percent of households across America’s 50 largest cities.
Most studies of urban inequality look at inequality in terms of metro areas, which include center cities and their suburbs. While useful, this approach can mask significant differences between cities and suburbs, as Ben Adler recently pointed out over at Grist. The Brookings study tracks the gap between the haves and have-nots within just those primary cities, using the most recently available data from the U.S. Census Bureau covering 2012-2013.
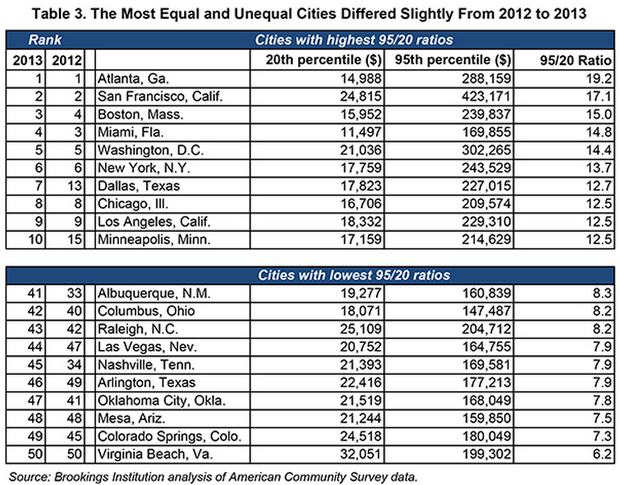
The chart below, from the study, shows the most and least unequal cities based on the 95-20 ratio. Atlanta ranks as the nation’s most unequal: The incomes among the top 5 percent there are nearly 20 times what the bottom 20 percent makes. San Francisco is next, followed by Boston, Miami, and Washington, D.C. Rounding out the top 10 are New York, Dallas, Chicago, L.A., and Minneapolis. (It's interesting to note that Minneapolis tends to rank as far less unequal on other measures .)
The majority of these highly unequal cities are concentrated on the coasts. Furthermore, four of the ten most unequal cities also number among America’s ten largest: New York (the most populous city in the country and the sixth most unequal), Dallas (ninth largest, seventh most unequal), Chicago (third largest, eighth most unequal) and L.A. (second largest, ninth most unequal). This is in line with several recent economics studies that find inequality increases alongside the size of cities.

Conversely, the least unequal cities are considerably smaller and mostly concentrated off the coasts: Virginia Beach, Colorado Springs, Mesa, Arizona; Oklahoma City, Arlington, Texas; Nashville, Las Vegas, Raleigh, Columbus and Albuquerque.
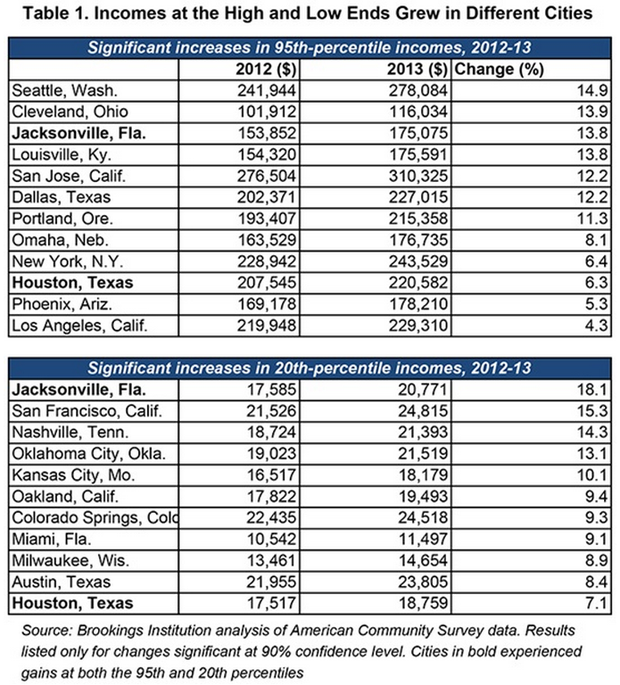
The rich got even richer between 2012 and 2013 in 12 of the nation’s 50 largest cities, according to the analysis. The cities where the top 5 percent saw the biggest gains are a mixed bunch, including Cleveland, Jacksonville, and Louisville, as well as Seattle, San Jose, New York, and L.A., as the table below shows. Albuquerque, New Mexico, was the only large American city where the income of the top 5 percent actually declined between 2012 and 2013.

On the flip side, the incomes of the bottom 20 percent increased in 11 of the 50 largest cities. Despite its high level of overall inequality, the bottom 20 percent of earners in San Francisco saw their incomes grow considerably. There are two cities—Jacksonville and Houston, both highlighted in bold on the table above—that saw significant gains in the incomes of both the top 5 and bottom 20 percent.

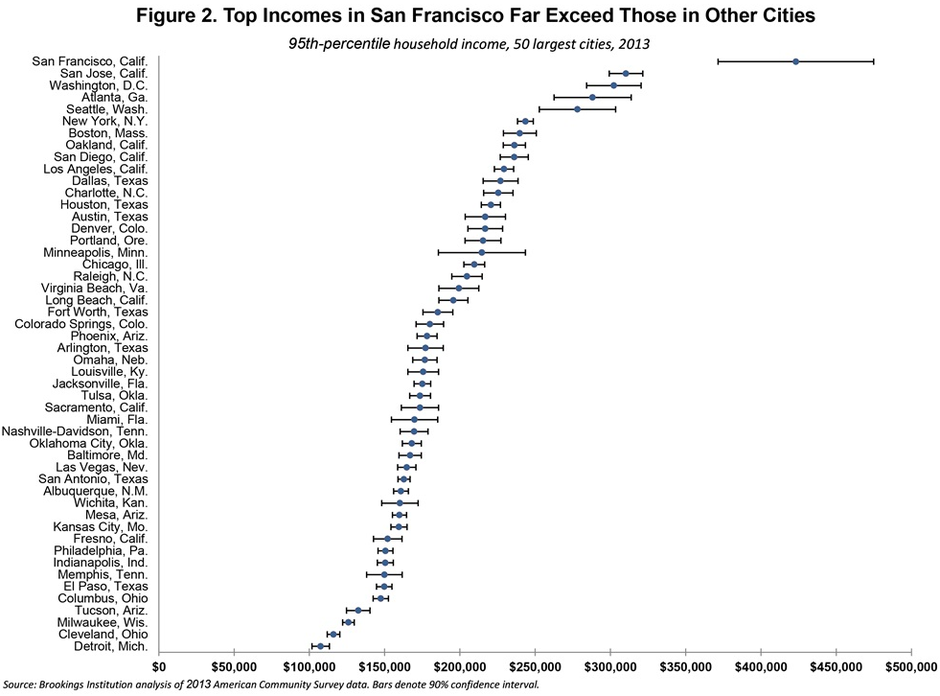
The chart above shows just how comparatively rich the top 5 percent are in America’s 50 largest cities. The incomes of the top 5 percent in San Francisco are almost literally off the chart. But the rich are also pretty darn rich in San Jose, Washington, D.C., Atlanta, Seattle, New York, Boston, and L.A.
Income inequality is high across the country. But it‘s even worse in our largest and most advanced cities. I’ve said it before: In our increasingly dense and clustered world, concentrated advantage sits side by side with increasingly concentrated disadvantage.
( Top image via Mark Winfrey / Shutterstock.com )


