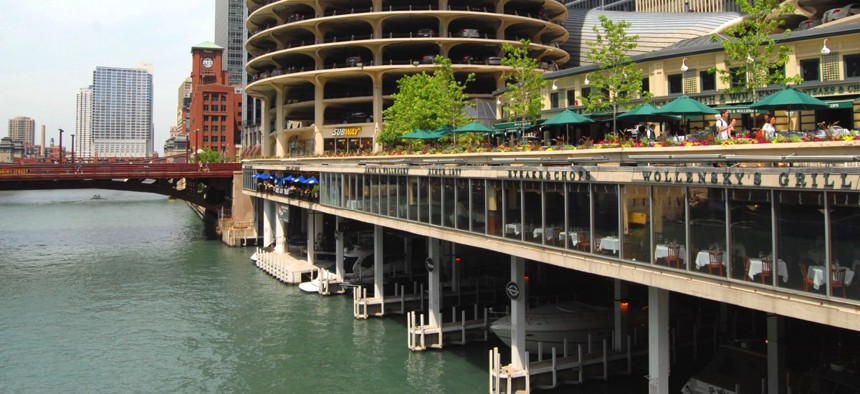
How Chicago Is Catching Restaurant Health Violations Faster

Lissandra Melo / Shutterstock.com

Connecting state and local government leaders
The city can forecast the “riskiest” dining establishments.
Chicago restaurants cutting corners beware, the city’s Department of Public Health is now prioritizing sanitation inspections with predictive analytics.
With three dozen inspectors responsible for checking more than 15,000 establishments—nearly 470 per person—the nation’s third-largest city gathered data from 100,000 inspections, 3-1-1 complaints, business descriptions and other departments to forecast where critical violations might occur.
Those restaurants were inspected first over a two-month period, where critical violations were discovered, on average, 7.5 days sooner than they would’ve been found otherwise.
When the health department combined datasets with the Department of Innovation and Technology the city reported:
A dozen variables had substantial relationships with the likelihood of an establishment failing a food inspection.
Information about the food establishment, such as its CDPH-assigned risk level and whether the establishment had failed previous inspections, served as important predictors. Information about the establishment's community, such as its location and nearby sanitation complaints made through 311, was also related to the most severe violations.
When factoring all of these items together, the research team was able to provide a likelihood of critical violations for each establishment, which was developed to prioritize which ones should be inspected first.
Critical violations, like improper food temperature control, are anything that might start or spread food-borne illness and result in a failed inspection. At least one such violation is found in 15 percent of inspections, and the health department sought to reduce the risk of prolonged exposure.
Minus prolific weather data, every dataset used by Chicago’s analytics team was already on the city’s open data portal containing hundreds of datasets.
When the health department conducted 1,637 inspections between September and October, 258 had a critical violation and 141, or 55 percent, one found in the first month. Contrast that with the city’s new computer algorithm gauging violation probabilities, which would’ve seen 178 restaurants, or 69 percent, with critical violations inspected in the first month.

Per the city:
That is, an additional 37 establishments would have been cited for violations in the first month, as opposed to being discovered later, potentially after patrons became ill.
Chicago made its food inspection forecasting model available as an open source project to be shared with statisticians, researchers and other cities, as well as improved upon.
(Photo by Lissandra Melo / Shutterstock.com)

NEXT STORY: When your phone tells you to stop texting and drive


