Mapping U.S. Geographic Variations in Outpatient Antibiotic Prescribing

Karramba Production / Shutterstock.com
Knowing where antibiotics are prescribed most often could help effectively target antibiotic stewardship efforts.
The prescribing of antibiotics in outpatient health care facilities, such as primary care clinics and emergency rooms, represents a large proportion of antibiotic use in the United States. One study found that these settings accounted for over 60 percent of all dollars spent on antibiotics in the U.S. in 2009.* Because of this contribution to overall antibiotic prescribing, any efforts to minimize the threat of antibiotic resistance and improve patient safety must focus on improving antibiotic use in outpatient facilities.
One important aspect of outpatient antibiotic stewardship is understanding variations in antibiotic prescribing. For example, are patients in certain states prescribed antibiotics at a higher rate than those in other locations? What types of providers account for the largest amount of antibiotic prescribing among outpatients? This type of evaluation affords a better understanding of how antibiotics are prescribed in the United States and also allows for improved targeting of antibiotic stewardship efforts.
The Centers for Disease Control and Prevention examined 2011-13 IMS Health Xponent data on outpatient prescribing in the United States. Presented below are select results from this analysis, focusing on geographic variation in the rate of prescriptions and the types of providers ordering antibiotics in outpatient settings.** Additional analysis, supported by The Pew Charitable Trusts, is available on the agency’s website.
Geographic Variation in Outpatient Prescribing
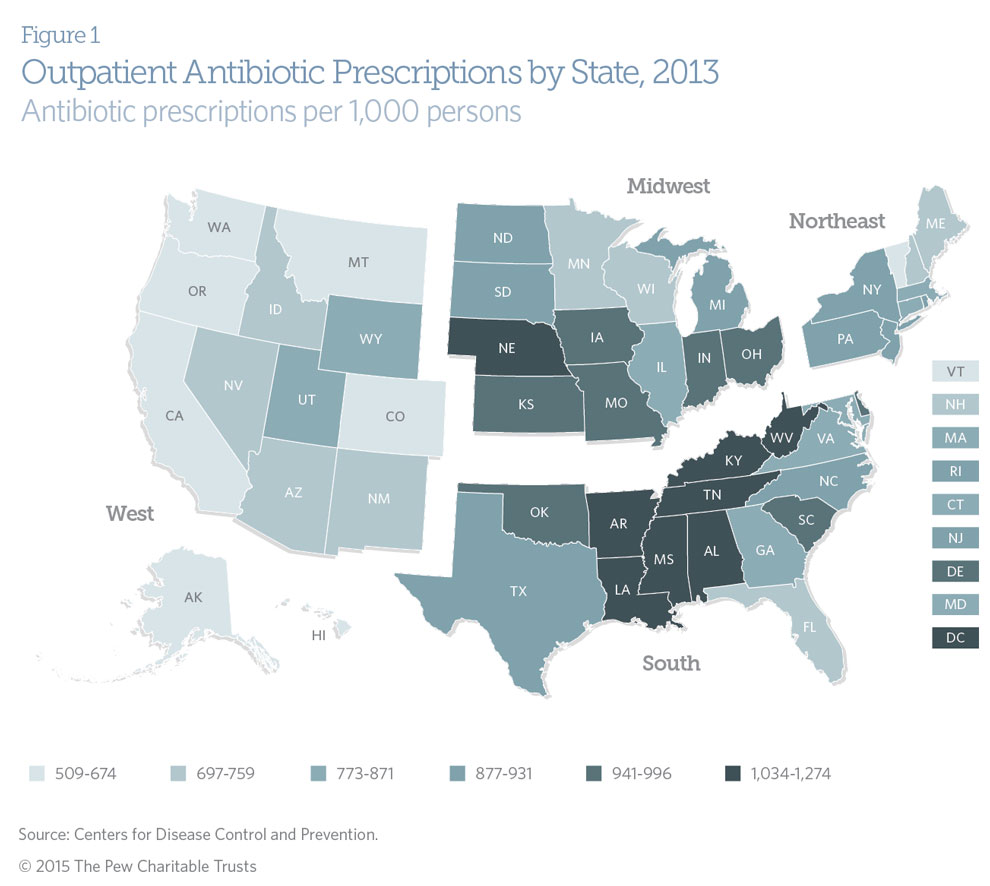
Clear geographic variation exists in the prescribing of outpatient antibiotics in the United States. On average, individuals in Southern states are prescribed more antibiotics than those in any other part of the country.*** In contrast, Western states had the lowest prescribing rates overall. For example, individuals in West Virginia, the state with the highest antibiotic prescribing rate, received over twice as many antibiotics in 2013 as those in Alaska, the state with the lowest prescribing rate (after adjusting for differences in population size). Eight states—all but one of them in the South—and the District of Columbia averaged more than one antibiotic prescription per person annually. Data from 2011 and 2012 show a similar pattern.
Although geographic variation alone does not indicate how much of these states’ antibiotic prescribing is unnecessary or inappropriate, it highlights regions where targeted antibiotic stewardship efforts may prove useful.

Outpatient Prescribing by Provider Type
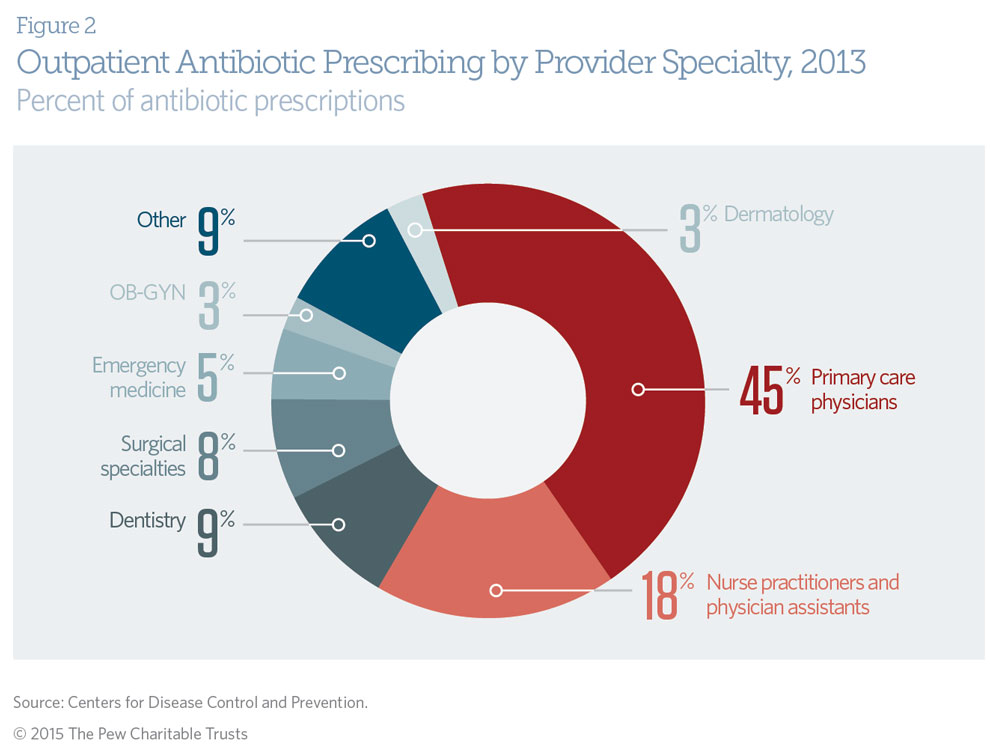
Understanding which types of health care practitioners most frequently prescribe outpatient antibiotics can help to prioritize antibiotic stewardship efforts. Primary care physicians—including family practice doctors, pediatricians, and internal medicine physicians—are key providers of outpatient health care services in the United States. Collectively, they accounted for 45 percent of all outpatient antibiotic prescriptions in 2013. Engaging these practitioners will be essential to improving outpatient antibiotic stewardship.

A wide range of other health care providers also prescribe antibiotics in outpatient settings. In 2013, nurse practitioners and physician assistants accounted for 18 percent of all outpatient antibiotic prescriptions. Examples of other specialties that regularly prescribe antibiotics include dentists (9 percent), emergency medicine physicians (5 percent), and dermatologists (3 percent). Although the proportion of total antibiotic prescriptions is not indicative of the appropriateness of prescribing, targeted engagement of these and other outpatient providers in antibiotic stewardship efforts could have a meaningful impact on reducing unnecessary antibiotic use.

Endnotes
* Katie J. Suda et al., “A National Evaluation of Antibiotic Expenditures by Healthcare Setting in the United States, 2009,” Journal of Antimicrobial Chemotherapy 68 (2013): 715–718, doi:10.1093/jac/dks445.
** Centers for Disease Control and Prevention, “Measuring Outpatient Antibiotic Prescribing – Outpatient Antibiotic Prescription Report by Year,” accessed November 15, 2015, http://www.cdc.gov/getsmart/community/programs-measurement/measuring-antibiotic-prescribing.html.
*** For this analysis, the four U.S. regions—Northeast, South, Midwest, and West—were based on U.S census regions: http://www2.census.gov/geo/pdfs/maps-data/maps/reference/us_regdiv.pdf.
This article was originally published by The Pew Charitable Trusts as part of the Antibiotic Resistance Project.
NEXT STORY: CfA announces 2016 fellows, partner cities


