Virginia Beach puts big data to work as it plans for sea level rise

Tracking rising water levels in Virginia's coastal areas involves IoT, layered technologies and local partnerships.
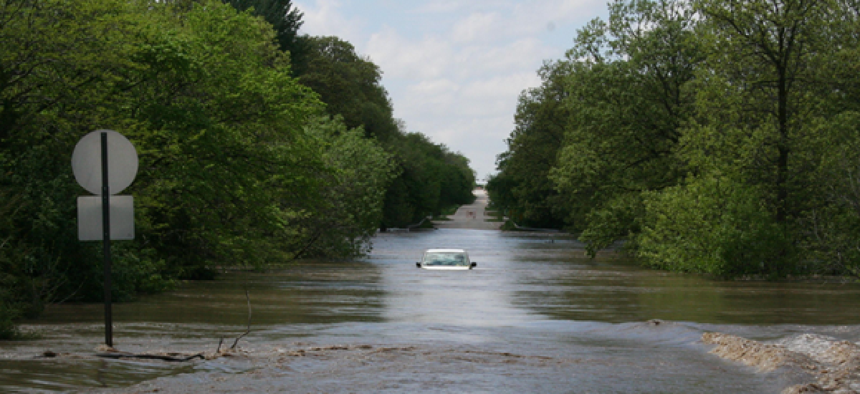
As a result of tidal flooding and severe costal storms, sea levels in Virginia Beach have risen nearly a foot over the past 58 years. City officials are working with researchers, state and federal authorities to develop a response to the frequent flooding problem. They plan to develop a hydrodynamic modeling system by using data from sensors that measure water levels and wind speeds.
With funding from the National Institute of Standards and Technology, 24 sensors were installed in Virginia Beach, Newport News and Norfolk over the past 18 months. With an award from Amazon Web Services’ City on a Cloud Innovation Challenge, Virginia Beach officials established a StormSense web platform that incorporates Esri’s geographic information system, along with data from sensors funded by NIST and the U.S. Geological Survey, to track water levels. The cloud-based platform makes it easier for other communities in the Hampton Roads region to access the data and check for flooding near bridges or on roads.
“We want citizens to be able to make actionable decisions based on the sensors that we’ve placed in the field, so these sensors become not just useful for research or planning decisions,” said Derek Loftis, program manager for StormSense at the Virginia Institute of Marine Science (VIMS).
In January, Virginia Beach officials began testing an Alexa skill to provide information directly to residents and emergency managers for their day-to-day needs.
Making the data suitable for Alexa involved simplifying the names of the sensors to physical locations rather than using their longer station names. StormSense and Virginia Beach officials are also exploring adding other capabilities to the Alexa skill to allow users to get a sense of the water levels in their neighborhoods.
In November 2017, Loftis and his team coordinated with local media outlets to conduct a ground test of the sensor measurements during the "king tide," the highest predicted tide of the year. The event called “Catch the King” involved 510 volunteers across 12 localities collecting 53,000 time-stamped GPS flood measurements over a four-hour period on Nov. 5.
The volunteers were trained to observe and record measurements through photos and GPS location marking using the Sea Level Rise app, created by non-profit Wetlands Watch.
“Some of the sensors had only been in the field for two to three months, so it helped to validate some of the water levels at nascent locations,” Loftis said. “It also provided us with an opportunity to verify and ground truth a model that developed as part of my dissertation on Hurricane Sandy in New York City.”
The hydrodynamic model will give Loftis a sense of water levels between sensors and will allow VIMS to extend the use of tidal forecast algorithm called Tidewatch with information provided from the recently installed StormSense and USGS sensors for the first time.
Once the sensors have been operational for at least 90 days, the data can be used to forecast tidal flooding 24 to 48 hours in advance, which will be particularly helpful in the spring and fall seasons -- when floods inundate roadways eight to 10 times a year.
Virginia Beach is also interested in adding cameras to the sensors on bridges and using AWS DeepLens deep-learning enabled video cameras to track images of water level rise. Combined with AWS Rekognition, the cameras use pixelated edge detection to determine rise levels.
“We want to tie the information from the AWS DeepLens cameras that can track the images of water-level rise and fall under bridges so we can use machine learning to determine the water-level impact depending on different relevant factors,” Sridhar Katragadda, a system analyst at the Virginia Beach Information Technology Department, said.
When it comes to planning for the future, officials in the Hampton Roads area are taking information from StormSense and comparing it with data from the National Water Model released by the National Oceanic and Atmospheric Administration in August 2016.
“We can compare our sensors at the same locations by cubic feet per second volume of water under the bridges … to the NWM and the different models that VIMS is creating based on our sensors,” Katragadda said. “Tracking the data over a seasonal cycle provides us with more details from the sensors that can be incorporated into our future plans.”


