Distressed Communities Index Underscores Economic Divides

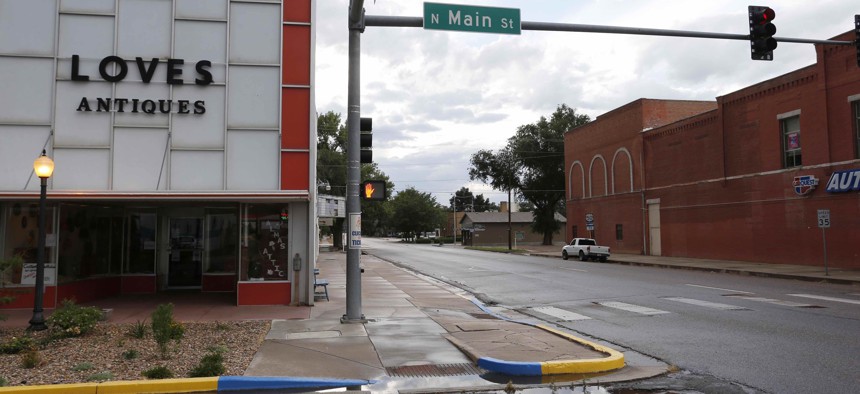
This June 30, 2016 photo shows an antique store on an intersection in Rocky Ford, Colo., in Otero County. AP Photo/Brennan Linsley

Connecting state and local government leaders
A new study finds sharp differences between communities that have prospered and fallen behind during the past decade.
New research highlights the widening fault lines between struggling and well-off communities across the U.S. and suggests more prosperous areas have fared better as the economy has improved.
Economic Innovation Group, a bipartisan think tank, this week released its Distressed Communities Index, which measures the economic well-being of ZIP codes, localities and congressional districts.
The research looks at communities across two time frames: 2007-2011, which covers the onset of the Great Recession and the immediate years after it, and 2012-2016, when the U.S. saw a gradual recovery.
Measures such as the percentage of adults with high school diplomas, poverty and unemployment rates, housing vacancies and median income are used to come up with an index score for communities.
Based on that score, a place is assigned to one of five categories: prosperous, comfortable, mid-tier, at risk, or distressed.
For the 2012 to 2016 timeframe, 86.5 million Americans—about 27 percent of the U.S. population—lived in prosperous ZIP codes. Another 50 million lived in ZIP codes that were distressed, the report says.
The contrast between metrics for prosperous and distressed communities is stark.
For instance, the percentage of adults without high school diplomas in the average prosperous ZIP code between 2012 and 2016 was 5.4 percent. In distressed ZIP codes it was 21.9 percent.
Meanwhile, the poverty rate in the average prosperous ZIP code was 6 percent, while in the average distressed ZIP code it was 26 percent.
Then there's the jobs recovery.
Prosperous ZIP codes had a job surplus in 2016 of 3.6 million jobs, compared to 2007 in the run up to the recession. Jobs in these places recovered fully by 2013, according to the EIG research.
In contrast, distressed ZIP codes have 1.4 million fewer jobs in 2016 compared to 2007.
"Distressed and prosperous ZIP codes don’t simply represent two ends of a statistical spectrum; they represent two almost diametrically opposed experiences of living in the United States," the report says.
Across the two time periods the study looked at, the share of people living in prosperous and comfortable ZIP codes rose by about 15.7 million people, while the number residing in distressed ZIP codes fell by about 5.9 million.
Population dynamics like births, deaths and migration help to explain these trends. But the study points to another factor as well. Compared to the earlier time periods, the distressed ZIP codes in the 2012-2016 timeframe tended to be more rural.
"The decrease in total population in distressed ZIP codes did not signal a substantial out-migration from struggling communities," the report says. "Instead it reflected an intensifying ruralization of distress as the well-being of more sparsely populated communities deteriorated relative to more populous and denser ones."
Louisiana, New Mexico and West Virginia had more of their ZIP codes slip into the distressed category across the two time periods.
Those states, along with Alabama, Arkansas and Mississippi, are the six where about one-third or more of the residents were living in a distressed community between 2012 and 2016, according to the report.
In states such as Utah, Colorado and Minnesota on the other hand, between 46 and 50 percent of the population was living in a prosperous ZIP code during those years.
Metro areas with the greatest concentrations of residents living in prosperous ZIP codes in recent years included the areas encompassing Minneapolis and St. Paul, Minnesota; Madison, Wisconsin; and Provo, Utah, where the percentage of people living in the well-off communities ranged from 61 percent to 65 percent.
At the other end of the spectrum were the metropolitan areas that include places like Bakersfield, California; McAllen, Texas; and Memphis. The percent of the population living in distressed ZIP codes in those places ranged from 40 percent to nearly 50 percent.
Looking to businesses, the researchers say that the U.S. lost about 350,000 establishments between 2007 and 2011. The national economy then added about 400,000 through 2016. But prosperous communities added more net new businesses than the other 80 percent of ZIP codes combined between 2012 and 2016, the report says.
It adds: "Where businesses returned bore little relation to where they had previously disappeared."
Bill Lucia is a Senior Reporter for Government Executive's Route Fifty and is based in Washington, D.C.

NEXT STORY: Attorney General Calls Out Judge on Census Citizenship Question


