There Could Be Millions More Americans Living in Poverty Than Officially Reported

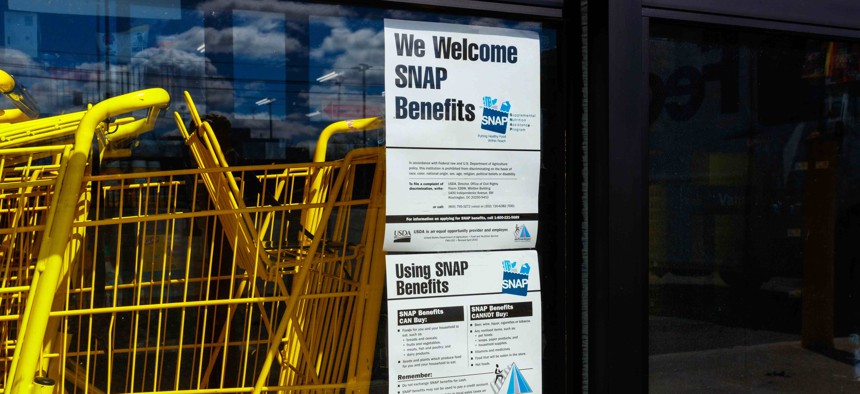
The federal poverty level is used to help determine eligibility for the Supplemental Nutrition Assistance Program, or SNAP, and other benefits. Shutterstock

Connecting state and local government leaders
New research suggests poverty statistics do not fully account for how price inflation differs for the rich and poor.
About 38 million Americans were living in poverty last year, according to official estimates. But new research says those numbers might be understated because inflation in the price of goods is hitting people at the bottom end of the earnings ladder harder than those at the top.
Using alternative inflation adjustments described in the research paper means over 3.2 million more people would have been added to the federal government’s poverty statistics in 2018.
That’s significant because the federal poverty line helps determine who is eligible for programs meant to assist poor and low-income households, like Medicaid and food stamps.
“These measurement choices seem sort of technical, bureaucratic and therefore sometimes kind of boring,” said Christopher Wimer, a co-author of the paper and a director of the Center on Poverty and Social Policy at Columbia University.
“But they really have pretty profound implications for peoples’ lived experiences,” he added. “Because the way this translates through is access to benefits, eligibility for programs.”
Underpinning the new research is a phenomenon known as “inflation inequality”—the idea that higher and lower income households face different inflation rates. An inflation rate, in general terms, measures how the average price of goods and services in a place rises over time.
One of the other co-authors of the new paper, Xavier Jaravel, a professor at the London School of Economics, published research earlier this year that looked at inflation inequality using datasets from 2004 to 2015, including price scanner data from retail stores.
This earlier work by Jaravel indicates that the annual inflation rate is 0.44 percentage points higher, on average, for the bottom 20% of earners in the U.S., compared to the top 20%.
Jaravel’s work suggests that what’s driving this difference is increasing inequality, with the greatest gains in income in recent years going disproportionately to people who are wealthier.
Competition among companies who want to sell goods to richer people is depressing prices for items that they typically buy, while the cost of goods that lower-income households would regularly purchase is rising more in line with usual inflation rates.
Using the alternative inflation adjustment from Jaravel's research, the authors of the new paper also found that income inequality was greater than what’s captured by official measures.
With conventional inflation adjustments, the gap in household income growth between the top and bottom fifths of the nation’s earners widened to about 15 percentage points between 2004 to 2018, with income for the low earners falling by about 1 percentage point.
But applying the alternative adjustment shows that income for the bottom fifth of earners declined by 7 percentage points and that the gap is closer to around 21 percentage points.
Wimer noted that the nation’s official poverty line was developed in the 1960s based on the cost of food, but that since that time costs like housing and utilities have grown to consume an increasing share of peoples’ household budgets.
The Trump administration, meanwhile, has floated the idea of changing the way inflation adjustments are factored into the poverty line. Wimer says the proposals, if anything, would make the threshold increase at an even slower rate than what’s outlined in the paper.
“That would result in fewer people being found in poverty,” he said.
“Most people think that the official poverty line is already too low,” Wimer added. “When you take something that’s too low and make it grow slower, you’re worsening the problem.”
A full copy of the research paper can be found here.
Bill Lucia is a Senior Reporter for Route Fifty and is based in Olympia, Washington.

NEXT STORY: Closing the Gaps in State Sexual Assault Laws


