Officials Apologize, Retool Coronavirus Chart After Backlash

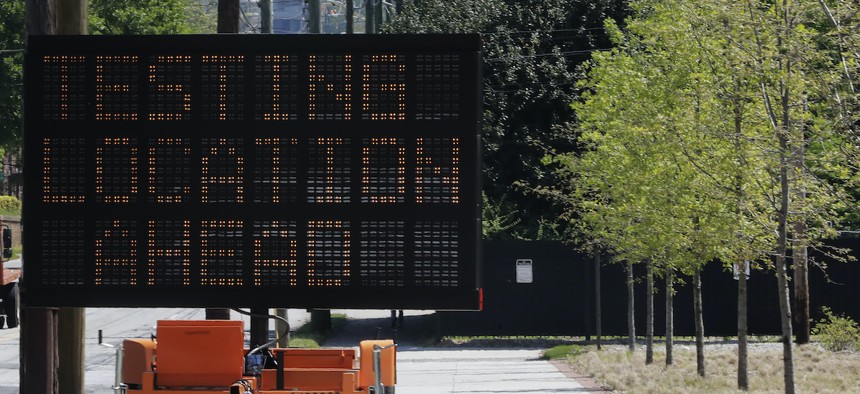
A sign reading "Testing Location Ahead" is seen near the COVID-19 testing area on Georgia Tech's campus, Monday, April 6, 2020, in Atlanta. Associated Press
A graph released by the Georgia Department of Public Health purported to show a steady decline in new coronavirus cases, but the data was presented out of order.
After legislators and reporters questioned its methodology, the Georgia Department of Public Health last week revised a graph that had purported to show a steady decline in new coronavirus cases in the five counties hardest hit by the pandemic.
The bar graph, posted on the department’s website on May 10, a Sunday, illustrated a clear downward trend in the number of new confirmed cases. But the presentation was unorthodox—the data was plotted out of chronological order (April 28 came before April 27; another three-day stretch placed case numbers from May 7, April 26 and May 3 sequentially), and the counties switched spots from day to day depending on their caseload. Whichever county had the highest number of cases appeared farthest to the left, making the overall trend appear to decrease over time.

Officials noticed. State Rep. Scott Holcomb, a Democrat from Atlanta, noted that businesses and residents use the data to make daily decisions about whether to resume service or simply venture out in public.
“This data is being used to inform state policy, and it's also being used by individuals,” he wrote on Facebook. “It's incredibly important for the data to be as accurate as possible and to be presented in a manner that is not misleading.”
Holcomb sent a letter to the governor’s office outlining his concerns. By Monday, the department had revamped the graph to present the numbers in chronological order and to keep each county in the same location from day to day. Candace Broce, a spokeswoman for Gov. Brian Kemp, said that afternoon that the original graph had been intended “to show descending values to more easily demonstrate peak values and counties on those dates.”
“Our mission failed,” she said on Twitter. “We apologize. It is fixed.”
A spokesman for the governor added on Twitter that Kemp’s data team thought the presentation “would be helpful,” but a spokeswoman for the Department of Public Health told the Atlanta Journal-Constitution that the chart displayed incorrectly because of an error in how it sorted dates. A day later, Holcomb wrote on Facebook that Kemp’s office did not explain to him in detail why the data was presented out of chronological order.
“The only information provided was that the vendor who publishes the data on the DPH website thought it would be helpful,” he said. “I shared my opinion that it wasn't.”
Georgia began reopening non-essential businesses nearly a month ago, a decision Kemp said was based on “favorable data and more testing.” The reopening process began April 24 with a handful of businesses including gyms, bowling alleys and nail salons, and has since expanded to movie theaters and restaurants. Residents are required to continue social distancing and are encouraged to wear masks in public, among other restrictions.
Because the state was first, officials and residents across the country have been keeping tabs on Georgia’s Covid-19 data. But epidemiologists have said it may still be too early to draw conclusions. Coronavirus tests take time to process, and because Georgia backdates Covid-19 cases to the date the patient first showed symptoms, the data for confirmed cases on any given date may not be complete until two weeks later.
"If decision-makers in the state of Georgia want to use evidence-based criteria to continue to reopen, they must not conflate reporting lags with actual declines to suit preferred narratives," researchers from Georgia Institute of Technology's School of Biological Sciences wrote in a May 15 article for Slate. "Instead, they must deal with the evidence as it is."
Since last week, the Georgia Department of Public Health has changed its data formatting to reflect the lag in testing time, shading some sections of data and marking them as ‘preliminary’ on its daily status reports. Those numbers “should not be relied upon,” Holcomb said.
“The data in the non-shaded areas is deemed to be complete, meaning it is 14 days or older and should not be as susceptible to data lags,” he wrote on Facebook. “I find it is very helpful to view the graphs without the shaded area. It’s easier to track the trendlines.”
Kate Elizabeth Queram is a Staff Correspondent for Route Fifty and is based in Washington, D.C
NEXT STORY: Texas Allows Evictions to Proceed Again


