Estimating How Many Covid Cases and Deaths the Vaccine Will Prevent

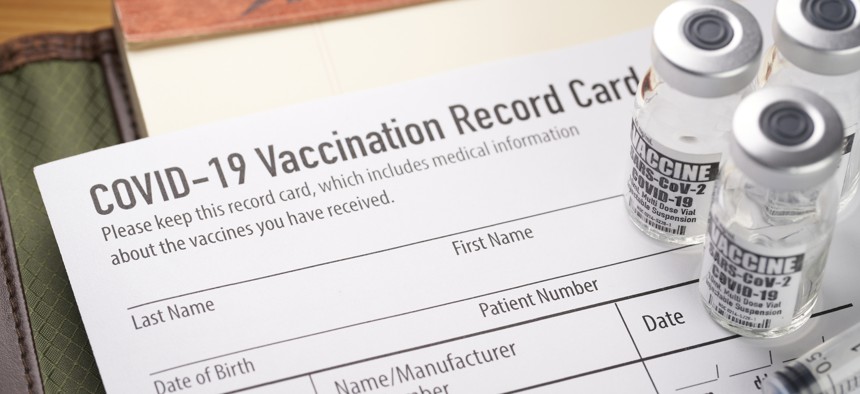
Covid-19 vaccination record card with vials and syringe. iStock.com/BILL OXFORD

Connecting state and local government leaders
COMMENTARY | A predictive model helps to highlight the potential benefits of the vaccine rollout, even providing data that is specific to different states and cities.
Public health crises are difficult to predict and even harder to mitigate. From the 2003 Severe Acute Respiratory Syndrome (SARS) outbreak to 2009’s H1N1 influenza pandemic to the current coronavirus pandemic, forecasting the medical consequences of a disease outbreak is daunting.
Last March, my team and I developed an artificial intelligence model to forecast Covid-19 positive cases across the nation. Since March 31, 2020, we’ve produced daily projections of new coronavirus cases to assist state, local, tribal and territorial planners in their response efforts.
With Covid-19 vaccinations underway, we have turned our attention to modeling the benefits of vaccinations (e.g. infections and deaths prevented). We hope our modeling can help the public and decision makers better understand the degree to which the vaccination effort now underway could prevent Covid-19 cases and deaths.
But estimating the benefits of the vaccination campaign is difficult since we don’t know how many new coronavirus cases will emerge in the future. Since the beginning of the pandemic, we have observed that the “R-value” (the average number of secondary infections caused by a single infected case) ebbed and flowed and varied state-by-state. This factors into how we model the results of the vaccine rollout.
Based on our observations, we expect (and model) that the number of new cases and deaths will continue to fluctuate. Building this fluctuation into our models is important because it helps to mitigate the possibility of over- or under-estimating the potential benefits of the vaccine. Most models don’t take this approach and instead hold the R-value constant.
By modeling states and localities separately, using their unique historical data for cases and deaths over the past 10 months of the pandemic, it is possible to predict more accurately what future local patterns with the outbreak might look like, rather than using broad overarching, assumptions for all jurisdictions.
So by building a model using these methods and examining the Biden administration’s goal of administering 100 million vaccine doses to Americans in 100 days, with a start date of Jan. 20, what story can we begin to tell about the benefits of Covid-19 vaccinations?
Because the vaccines take time to become protective, our analyses look at vaccine benefits after 120 days. If there were no vaccinations across the country, we projected approximately 8 million new confirmed Covid-19 cases nationwide in the 120-day span that began on Jan. 20. This is similar to the number of confirmed Covid-19 cases observed near the end of November 2020.
The benefit of the vaccinations starts to become noticeable about 60 days into the campaign as the number of averted cases grows. This delayed benefit is due to the period before vaccines become protective and the time to vaccinate a large number of people.
By 120 days after the start of vaccinations, our model shows that around 1.9 million new cases are prevented, assuming a rate of 100 million vaccinations in 100 days. That number grows to nearly 2.5 million if we can administer 150 million vaccine doses in 100 days.


Without vaccinations, our model projects roughly 155,000 new Covid-19 deaths nationwide in the 120-day span after Jan. 20. The benefit of vaccinations in preventing deaths becomes noticeable later because of the additional time it takes between an individual becoming infected and their potential death. The Biden administration’s campaign to administer 100 million or 150 million doses in their first 100 days could prevent around 25,000 or 33,000 Covid-19 deaths nationwide, respectively.
For illustrative purposes, we present similar vaccination benefits for a state (Arizona) and a county (Broward County, Florida). As one would expect, the number of confirmed Covid-19 cases and deaths averted in Arizona and Broward County are smaller than what we see nationwide, but the percentage of cases and deaths averted for these jurisdictions is similar to what our model projects for the nation.


In addition to the Biden administration’s vaccine distribution target, our model looks at the consequences of giving out vaccines at slower or faster rates. Planners at all levels can examine how their current vaccination rates compare to the modeling projections and see the number of Covid-19 cases and deaths that can be prevented at their current vaccination rate. Additionally, planners can see the expected benefits if their current vaccine rate improves.
With the nation in the midst of an extraordinary, nationwide Covid-19 vaccination campaign, it can be hard to fully grasp the benefits in real time. We hope that our modeling projections can help to show how widespread vaccinations will set us on a path to recovery.
Dr. Prasith “Sid” Baccam, is a computational epidemiologist, Manager of Emerging Technology, and part of the IEM Health team at IEM, the largest woman-owned disaster and crisis management firm in the world.

NEXT STORY: Model Warns of New Mosquito Invasion in Florida


