The States With the Weakest and Strongest Social Safety Nets

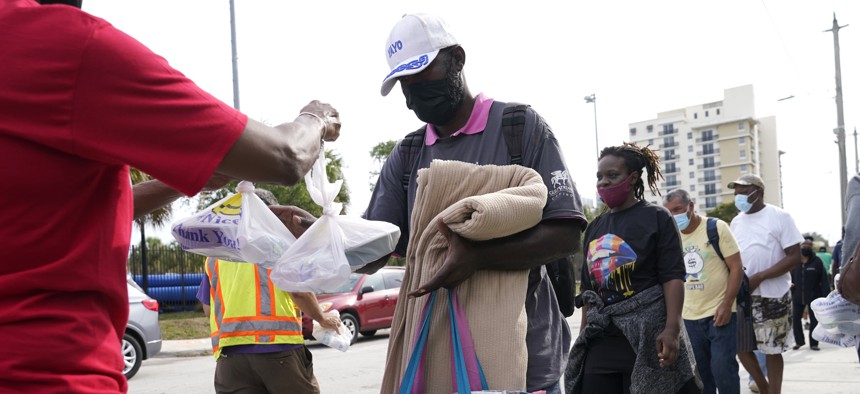
Residents stand in line for prepared meals during a food distribution held by the Overtown Youth Center and other local organizations, Monday, April 12, 2021, in the Overtown neighborhood in Miami. AP Photo/Lynne Sladky
New research allows for easy comparisons of how states stack up based on a variety of social welfare and pro-labor policies, and also offers a look at economic outcomes in each place.
States and regions around the U.S. that have weak social safety net programs and fewer worker protections also tend to have worse economic outcomes when it comes to measures like food security, employment and household earnings, according to new research.
The report from the left-leaning Center for American Progress also says that these places tend to have more residents who are racial and ethnic minorities, raising equity concerns. “Those weaker safety nets in those states exacerbate racial inequity at the national level,” said CAP policy analyst Justin Schweitzer, one of the report’s authors.
Programs and policies that the researchers looked at included things like the earned income tax credit, minimum wage levels, laws around unionization, unemployment insurance and Temporary Assistance for Needy Families, which provides households with cash assistance.
They found these types of programs to be weaker in the South, Midwest and West compared to the Northeast.
For example, the report says states in the South have, on average, the lowest TANF and unemployment benefits of any region, and also higher poverty rates and lower median incomes.
Southern states, compared to the Northeast, were 42 percentage points less likely to set a minimum wage above the federal level across three years the researchers looked at.
An interactive data tool that is available as part of the project allows users to make 50-state comparisons across different policies and economic outcomes.
While the researchers point out that many safety net programs are federally funded, they note that states often have control over how programs are designed and run.
Schweitzer said one thing that is notable about the findings is that when states have stronger or weaker safety nets, or worker protections, this tends to be reflected across a range of policies and programs. “It’s just showing how consistent the story is,” he said.
The authors of the report include some significant caveats.
While they say they've uncovered a “strong association” between safety net programs, worker protections and certain economic outcomes, they stop short of saying that the policies contributed to, or caused these conditions. “In the report, we were definitely very clear to say that we are not implying causation,” Schweitzer said.
They also emphasize that the regional groupings they rely on can mask local areas that are over- or under-performing based on the measures they’re looking at. “Regional boundaries are imperfect and can mask important differences within regions and states; for example, there are thriving economies at the local level in the South,” the report says.
Despite limitations like these, the data presents a window into how social welfare programs and laws that are favorable to labor stack up against various economic and demographic metrics. For instance, the interactive tool allows people to quickly produce a 50-state chart with food insecurity on one axis and unemployment benefits on the other.
Schweitzer emphasized that the coronavirus pandemic has laid bare how many Americans can end up turning to safety net programs in unexpected hard times.
“It’s often thought that these safety net programs are just for poor people and I’m never going to be poor, so they don’t matter,” he said. But he highlighted one estimate he’d seen recently that about three-in-five Americans will spend at least a year below the poverty line during their adult life. “This is something that affects everyone,” he said.
A full copy of their report is available here. The interactive data tool can be found here.
Bill Lucia is a senior editor for Route Fifty and is based in Olympia, Washington.
NEXT STORY: Disinformation May Be the New Normal, Election Officials Fear


