No More Rush Hour? A Look at the Pandemic’s Impact on Traffic

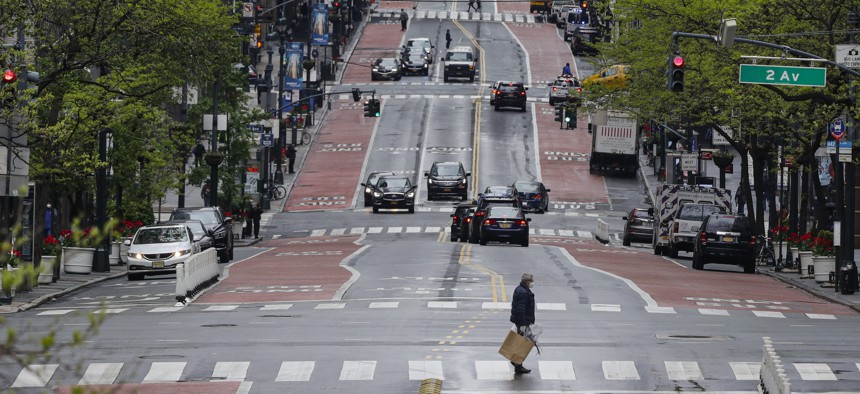
Pedestrians cross a nearly empty 42nd Street Friday, May 8, 2020, in New York. AP Photo/Frank Franklin II
The average number of vehicle miles traveled was 16% lower in July than the previous year, and rush hour traffic is now more spread out over time, according to a new report.
Rush hour may never be the same.
With more people working from home during the coronavirus pandemic, traffic congestion has significantly decreased across the United States. But while traffic has started to rebound in recent months as businesses have reopened, a new study finds the typical spike in morning traffic hasn’t returned to pre-pandemic levels and the evening rush hour is now spread out more throughout the afternoon.
The average number of vehicle miles traveled (VMT) across the United States was down 16% in July compared to the previous year, according to a report by StreetLight Data. While the decrease is a lot less compared to the initial 40% drop in vehicle miles traveled in April, the report suggests that traffic usage is unlikely to fully return to pre-pandemic levels.
“While some transportation experts predicted a VMT ‘rebound’ making up the difference for the year as a whole, we don’t see indications of that level of recovery,” the report states.
The report highlights how the reduction has affected commuter patterns. Pre-pandemic traffic patterns in most regions involved a sharp spike in morning traffic, followed by an afternoon lull and an evening rush hour. But in five cities analyzed by researchers—Chicago, Los Angeles, New York, San Francisco and Washington, D.C.—weekday traffic patterns now build “gradually toward a more sustained afternoon high,” the report found.
“While major metros still have peak PM commutes, those peaks aren’t as pronounced as they used to be,” the report states. “In Washington D.C., for example, we see a slightly earlier peak for PM travel than during the same period in 2019, but the buildup to that point is a steady increase instead of a sudden jump.”
StreetLight Data analyzes traffic patterns by using location data collected anonymously from cell phone applications and connected car navigation systems to understand where and when people travel.
Los Angeles and San Francisco have both begun to have a mini rush hour after lunch and experience longer periods of lighter congestion in the afternoon, the report found.
The pandemic has affected traffic patterns in other ways as well. While congestion is down, driving has actually become more dangerous with the rate of motor vehicle deaths per miles driven increasing by 23.5% in May 2020 compared to May 2019.
That hasn’t held true for wildlife, however, as the number of wildlife-vehicle crashes declined in three states by about 34%, according to one study.
The reduction in vehicle miles traveled was less pronounced in rural regions, particularly in areas that support essential industries where employees were required to continue reporting to work in person, the StreetLight report found.
One such example highlighted in the report is the comparison between two Wyoming counties: Goshen and neighboring Laramie. In Goshen County, a top ranching county in the state, the amount of vehicle miles traveled remained flat in April. But in Laramie County, home to the state capitol Cheyenne, the average number of vehicle miles traveled dropped by 27% that month.
Andrea Noble is a staff correspondent with Route Fifty.
NEXT STORY: Federal Government to Offer $10M to Research Covid Spread on Public Transportation


